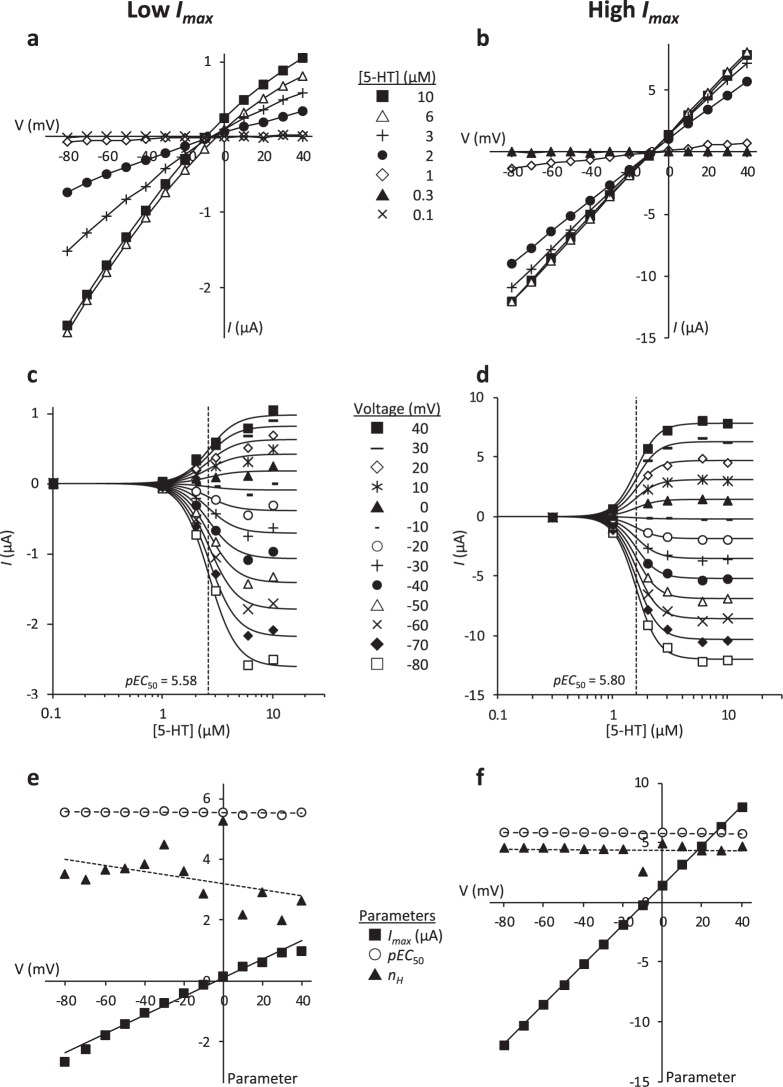
Figure 2.
The effect of holding potential on peak current response and pEC50 values. Illustrative current-voltage (I/V) data from two different oocytes that responded with low (a,c,e) and high (b,d,f) maximal peak current responses. (a,b) Current-voltage (I/V) plots at different 5-HT concentrations (■ 10 µM; △ 6 µM; + 3 µM; ● 2 µM; ⬦ 1 µM; ▲ 0.3 µM; × 0.1 µM). (c, d) Peak current shown as a function of 5-HT concentration at differing holding potentials (−80 to + 40 mV in 10 mV steps). The fitted curves represent the Partial Model in which pEC50 and nH parameters are constrained to be the same across all holding potentials for each oocyte. The pEC50 is indicated by the dotted line. (e, f) The relationship between the fitted parameters, Imax, pEC50 and nH, and the holding potential. The values shown are from the Full Model in which the parameters can adopt different values for each holding potential. The figures illustrate the variance in the unconstrained estimates of pEC50 and nH. Likelihood Ratio Tests comparing the Full and Partial Models suggest that there is no difference in the pEC50 and nH values between different holding potentials (Low responder: P = 0.74; High responder: P = 0.93). The straight line gradients (mean ± SE) of the data in Panel (e) are: Imax, 0.031 ± 0.001 (P = 3 × 10-11); pEC50, −0.00051 ± 0.00025 (P = 0.063); nH, −0.0100 ± 0.0062 (P = 0.14), and in Panel (f) are: Imax, 0.17 ± 0.0004 (P = 5 × 10-24); pEC50, −0.00015 ± 0.00029 (P = 0.62); nH, −0.0013 ± 0.0045 (P = 0.78). Note the differing y axis scales in the panels.

