Figure 3.
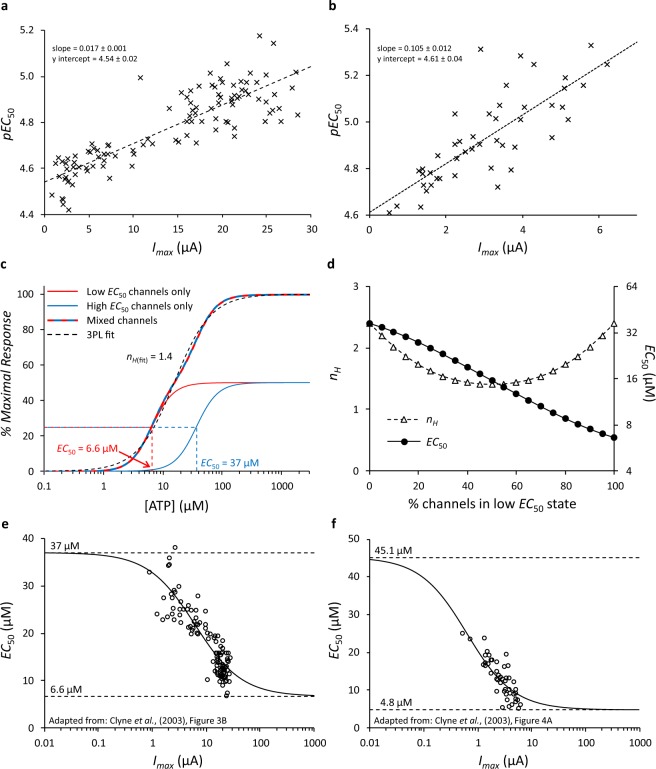
A representation and review of P2X2 data from Clyne et al. (2003). Imax and pEC50 from (a) native P2X2 receptors shown in Fig. 3B of Clyne et al.12 and (b) C-terminal 76 amino acid deleted P2X2 receptors shown in Fig. 4A of Clyne et al.12. Values were estimated by visual inspection and represented in a similar fashion to Fig. 1a in this report. (c) A simulation of the predicted response (fitted to the 3PL equation) resulting from two distinct populations of channels each with similar expression levels, Hill coefficients of 2.4, but with different EC50 values equal to 6.6 µM (red) and 37 µM (blue). The mixed population of channels has an intermediate EC50 of 15.6 µM and an apparently lower Hill coefficient of approximately 1.4. (d) Predicted change in apparent Hill coefficient (nH) and EC50 for a mixed population of the two channel subtypes defined in Panel (c), as the proportion of those subtypes changes from 0 to 100%. (e) A representation of Fig. 3B from Clyne et al.12 with the x axis shown on a log scale. The line is the hyperbolic model fitted by Clyne et al.12 indicating a high EC50 of 37 µM, a low EC50 of 6.6 µM and a mid-point Imax of 6.108 µA, as described in their manuscript. (f) An equivalent representation of Fig. 4A from Clyne et al.12. The line is the fitted hyperbolic model indicating a high EC50 of 45.1 µM, a low EC50 of 4.8 µM and a mid-point Imax of 0.637 µA. Panels (e,f) illustrate how the parameter estimates lie in relation to the data. Note that Clyne et al.12 constrained the lower EC50 values to be no smaller than the lowest measured EC50 and consequently the low EC50 limits (dashed lines) pass through the lowest value data points.

