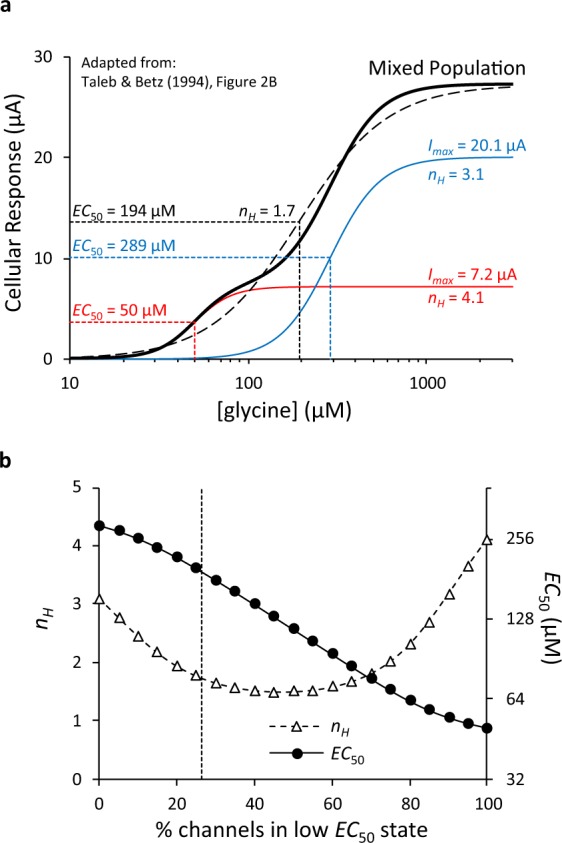
Figure 5.

A representation and review of data from Taleb and Betz (1994). (a) Representation of a mixed population of glycine receptors with differing EC50 and nH values derived from Fig. 2B of Taleb & Betz15. The mixed population (thick, black line) is the sum of two distinct populations (Red: Imax = 7.2 µA, EC50 = 50 µM, nH = 4.1; Blue: Imax = 20.1 µA, EC50 = 289 µM, nH = 3.1). At maximal glycine concentrations, the low EC50 population conducts approximately 25% of the total current and the high EC50 population conducts approximately 75% of the total current. The EC50 values are sufficiently different that the mixed population has a biphasic pattern. A monophasic concentration-response model derived from such a scenario would resemble the dashed line and thus have an intermediate EC50 of 194 µM, and a lower nH of 1.7. (b) Predicted changes in overall EC50 and nH as the proportions of channels in low and high EC50 states vary. The dashed line indicates the scenario depicted in Panel (a).
