
Figure 6.
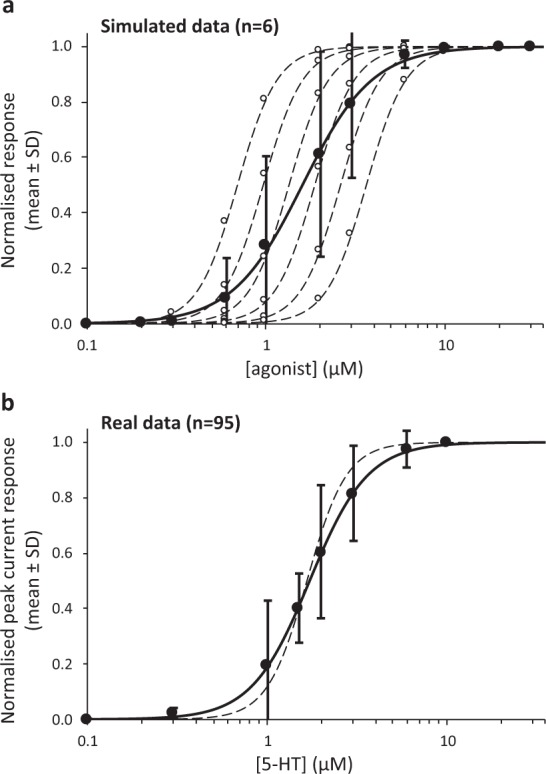
Effect of pooling concentration-response data on estimates of the Hill coefficient (nH). (a) Six simulated data sets are shown (- - - -) each with 11 data points (○) ranging from 0.1 to 30 µM, a normalised maximum of 1, and a Hill coefficient of 3.9. The pEC50 values differ and are: 6.20, 6.06, 5.92, 5.78, 5.64, 5.50. The mean ± SD of the six data points at each concentration are shown. A line of best fit (OLS) through the means is a 3PL model (——) with the maximum constrained to 1. The estimated pEC50 = 5.85 and nH = 2.26. It is evident that the estimated nH is biased down compared to the individual concentration-response data, and that there is substantial variance in the central part of the mean concentration-response curve. This pattern is expected when data are normalised and the pEC50s vary from one dataset to another. The extent of the bias is difficult to predict, but depends on the variance in the pEC50 values, the number of datasets, and the number and location of the data points. (b) Data from each of the 95 oocytes in our study were normalised to the response induced by 10 µM 5-HT. The mean ± SD for each 5-HT concentration was calculated from these normalised values. A 3PL model (——) was fitted (OLS) to the mean values with the maximum constrained to 1. The estimated pEC50 = 5.77 and nH = 2.69. The dashed line (- - - -) shows the 3PL model defined by estimates shown in Table 1 (pEC50 = 5.78; nH = 3.94).