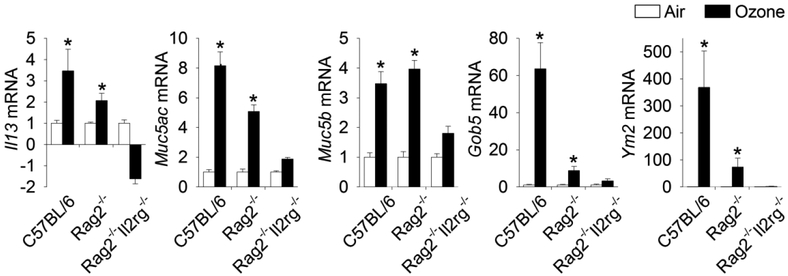
Figure 4.
Gene expression in 9-day ozone-exposed lungs. Relative fold increases in mRNA transcripts were analyzed for Muc5ac, Muc5b, Gob5, Il13, and Ym2. *Genes showing statistical significances (air vs. ozone/same mouse strain, p values < 0.05). Data are expressed as fold changes relative to their respective air-exposed controls ± standard error of the mean (n = 6/group). From Kumagai et al. 2017, Toxicol Pathol. 45(6):692–704.

