Figure 4.

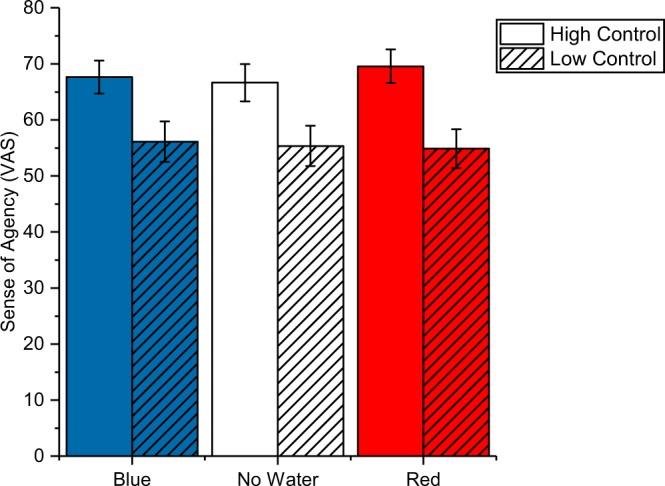
Sense of agency ratings. The graph depicts mean values (±SE) for each experimental condition. The rmANOVA revealed a main effect of condition (high vs. low control) demonstrating that the experimental manipulation was successful.

Sense of agency ratings. The graph depicts mean values (±SE) for each experimental condition. The rmANOVA revealed a main effect of condition (high vs. low control) demonstrating that the experimental manipulation was successful.