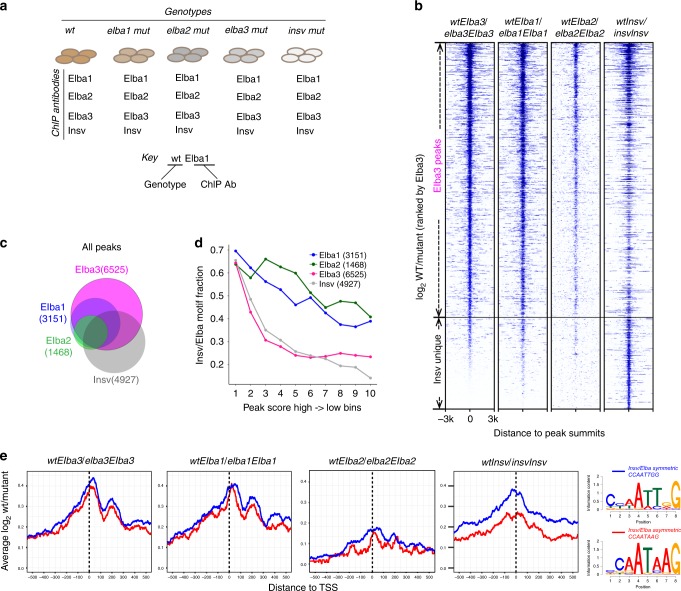
Fig. 1. Comparison of the ELBA complex with Insv-binding sites and motifs.
a Illustration of the ChIP-seq samples. The naming scheme: the gene names with all the letters in lower case denote genotypes, and the names with the first letter in upper case denote antibodies in ChIP. Two examples are shown. b For each factor, the peaks were called by using the ChIP-seq reads of wt against the ChIP reads of its cognate mutant. A heatmap of the ChIP-seq coverage ratio (log2 wt/mutant) centered at peak summits, ranked by the Elba3 signal, showing the peaks of Elba1, Elba2, and Elba3 largely overlap, while Insv has unique peaks. c A Venn diagram shows peak overlapping of the four factors. d The peak scores and the Elba/Insv motif enrichment are positively correlated. The peak scores were ranked and divided into ten bins (x-axis), and the fraction of motif-containing peaks was calculated for each bin. e The coverage ratio (log2 wt/mutant) centered at TSS is shown for the peaks that contain either the symmetric or asymmetric motif. The Elba factors show similar preference at both types of motifs, while Insv signal is higher at the symmetric motif. Logos of the Insv/ELBA motifs from de novo motif discovery are shown on the right.

