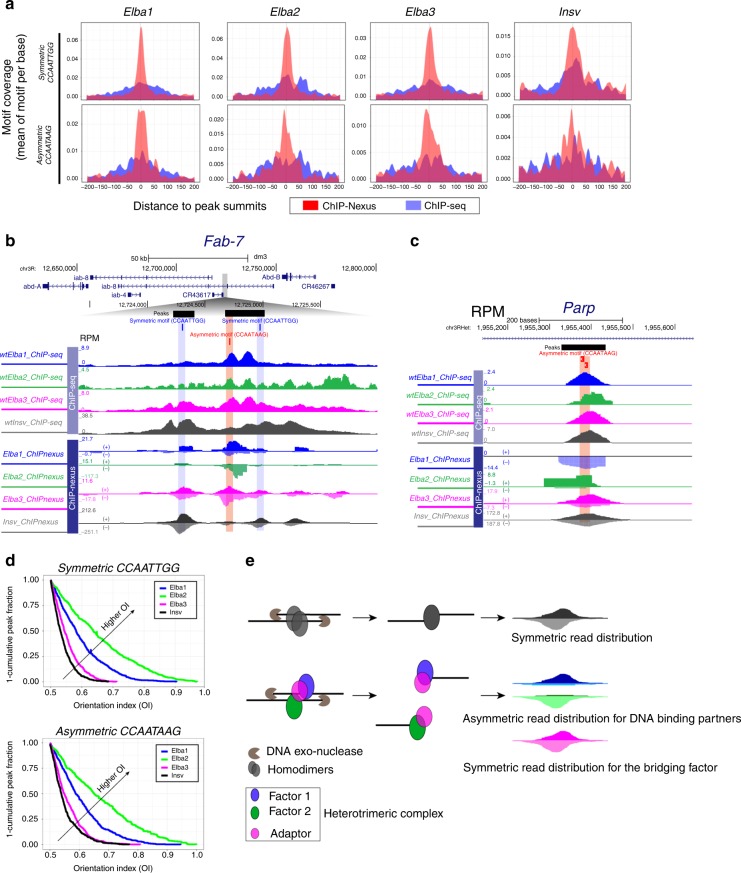
Fig. 3. ChIP-nexus distinguishes homodimer from heterotrimeric binding.
a Comparison of ChIP-seq and ChIP-nexus, showing centered motif distribution around the peak summits. The motif occurrence centered at the peak summits (x-axis) is plotted with mean motif coverage in “Motif Per Base” on the y-axis. b ChIP-seq and ChIP-nexus tracks of the Fab-7 region show broader ChIP-seq peaks while sharp ChIP-nexus peaks. Note: ChIP-nexus also shows asymmetric read distribution of Elba1 and Elba2 and symmetric distribution of Elba3 and Insv. Elba1 and Elba2 respectively prefer the “ + ” and the “−” strand of the CCAATAAG motif. c Another exemplary locus, Parp, exhibits a similar bias of strand asymmetry. d The orientation indexes (OIs), ranging from 0.5–1, were calculated for the top 500 ChIP-nexus peaks containing the symmetric or asymmetric motifs (see the Methods section). Elba1 and Elba2 display a higher OI tendency than Elba3 and Insv, suggesting asymmetric binding. e Illustration of how ChIP-nexus can capture symmetric versus asymmetric binding patterns by homodimers versus a heterotrimeric complex.

