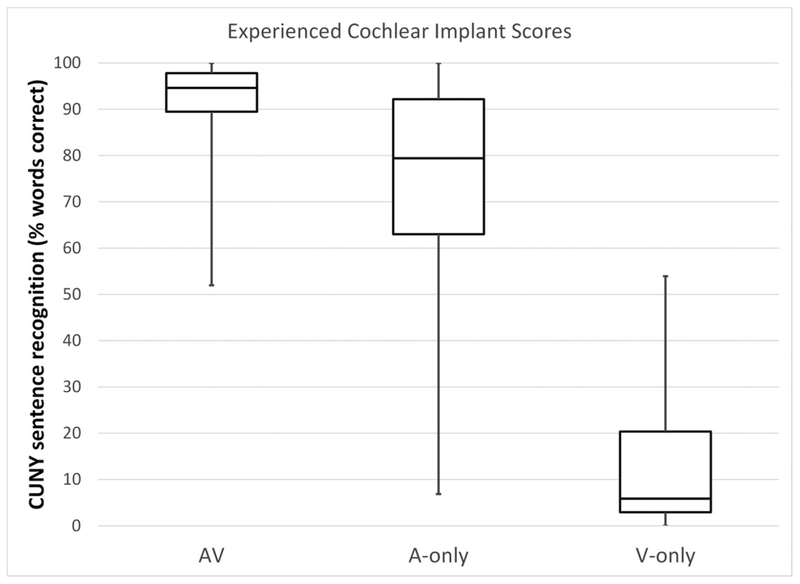
Figure 1.
Boxplots of scores for ECI users on CUNY sentence recognition in AV, A-only, and V-only conditions. For each condition, the median is represented by the horizontal line that divides the box into two parts. The upper limit of the box represents the 75th percentile and the lower limit of the box represents the 25th percentile. Upper and lower whiskers represent maximum and minimum scores, respectively.

