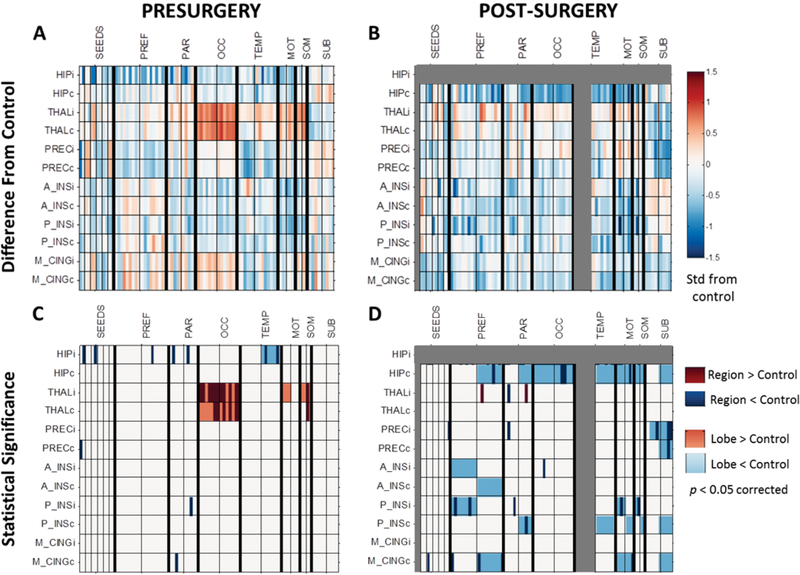
FIG. 1.
FC in patients with mTLE before and after surgery related to age-matched healthy controls. A: FC in mTLE before surgery compared to age-matched healthy controls (represented by zero). B: FC in mTLE after surgery compared to age-matched healthy controls. Values in panels A and B reflect the mean of the 95% confidence interval of the t-test between FC and zero. Units are standard deviations from age-matched healthy controls. C: Presurgical regions (dark colors) and lobes (light colors) were significantly different from age-matched controls (p < 0.05, Bonferroni correction). D: Postsurgical regions (dark colors) and lobes (light colors) were significantly different from age-matched controls (p < 0.05, Bonferroni correction). Seed regions are represented by each row and the first 12 columns. The remaining columns are arranged according to lobes of the brain, separated by thick black lines. Within lobes, all regions ipsilateral and contralateral to seizure focus are on the left and right side of the thin black lines, respectively. Connections involving the ipsilateral hippocampus and temporal lobe are gray to indicate that these were excluded from postsurgical analyses. i (following abbreviation) = ipsilateral to seizure focus; c (following abbreviation) = contralateral to seizure focus; HIP = hippocampus; THAL = thalamus; PREC = precuneus; A_INS = anterior insula; P_INS = posterior insula; M_CING = mid-cingulate; PREF = prefrontal; PAR = parietal; OCC = occipital; TEMP = temporal; MOT = motor; SOM = somatosensory; SUB = subcortical.

