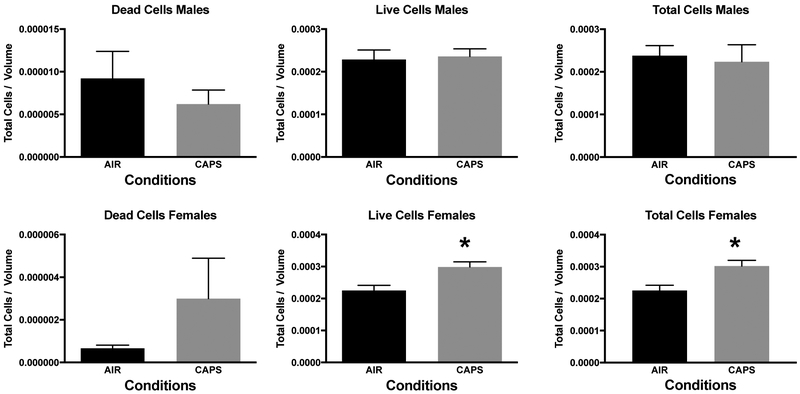
Figure 12.
Mean ± standard error levels of dead cells (left column), live cells (middle column) and total cells (right column) in nucleus accumbens at postnatal day 25 as evaluated by silver staining of males (top row) and females (bottom row) exposed postnatally to filtered air (Air) or to 45 ug/m3 CAPs. At this time point, changes were no longer evident in males, whereas females showed increases in both live cells and total cells.

