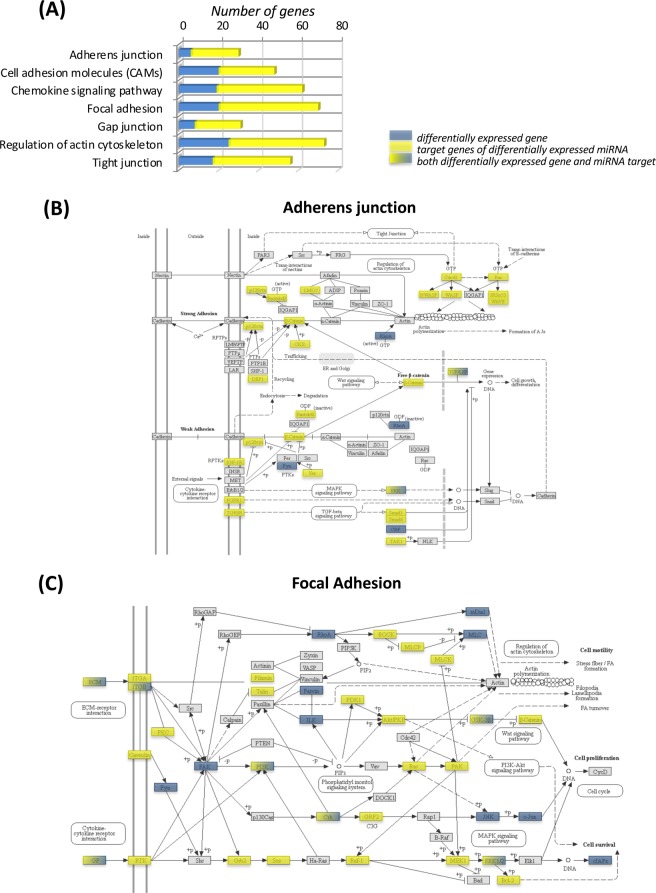
Figure 6.
Functional integration of differentially expressed genes and target genes of differentially expressed miRNAs. (A) Histogram represents cellular pathways involved in the regulation of endothelial function obtained using differentially expressed genes (blue), and target genes of differentially expressed miRNA (yellow), identified in at least one experimental dietary study group compared to control [C57BL/6J (WT) fed control diet (CD)]. Representative integrated analysis of differentially expressed genes, and target genes of differentially expressed miRNAs for (B) adherens junctions and (C) focal adhesion pathways. Blue = differentially expressed genes; Yellow = target genes of differentially expressed miRNAs; Color gradation from Yellow to Blue = genes identified to be both differentially expressed and to be targets of differentially expressed miRNAs.

