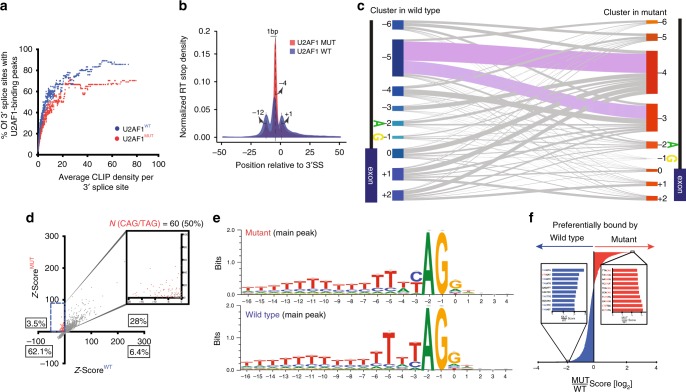
Fig. 3. Determining binding specificities of wild-type and mutant U2AF1.
a U2AF1 binds a subset of 3’ SSs. Maximum-likelihood analysis was utilized to determine the 3′ SS occupancy of wild-type and S34F mutant U2AF1. Each dot represents an average occupancy of a group of 40 genes, in relation to average CLIP density per 3′ SS. b Metagene analysis of wild-type and S34F mutant U2AF1 binding interactions to pre-mRNA 3′ SSs. Normalized RT-stop density is shown across 3′ SS positions on the x-axis. c RT stops >10 were assigned to clusters defined from a window of 3′ SSs of −6 to + 2 nucleotides utilizing 3′ SS annotation files. The cluster assignments for wild-type and mutant samples are shown in left and right, respectively. d Z-scores were generated based on random hexamer nucleotide motif frequencies bound to wild-type and S34F mutant U2AF1. A subset of Z-scores showing enrichment of 50% of the hexamers bound to mutant U2AF1 for CAG and its reverse complement CTG trinucleotides. e WebLogos depicting binding preferences of wild-type and mutant U2AF1 for the main peaks in b. Position 0 is the intron exon junction depicted by the figure. f Generation of a preferential binding score to wild-type and mutant U2AF1. The top 10 scoring hexamers and its common trinucleotide sequences preferentially bound to mutant U2AF1 and wild-type U2AF1 are shown in red and blue, respectively.

