Figure 3.
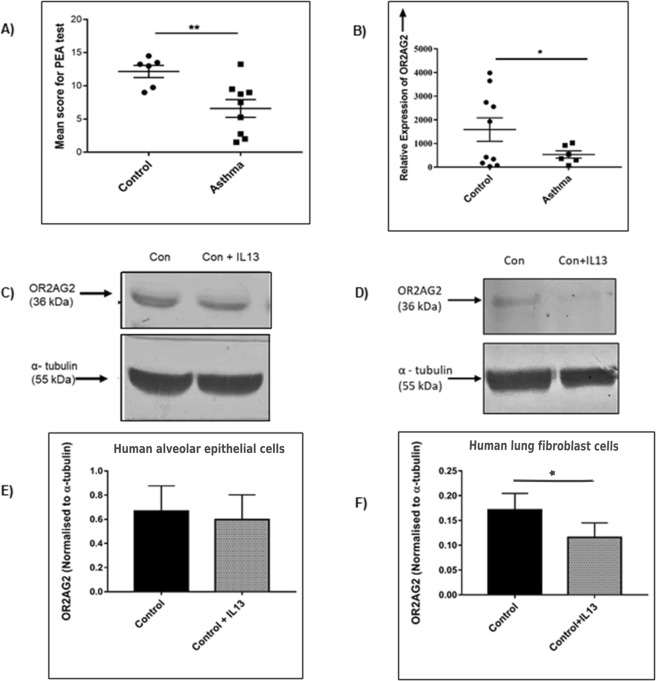
Threshold tests for phenotypic correlation in Family 1, OR2AG2 levels in human lung samples and in-vitro epithelial and fibroblast cells, with or without induction with IL-13. (A) Plot showing significant decrease in mean score for odor threshold in subjects with asthma as compared to control subjects from the same family when different concentration of 2-phenylethyl alcohol (PEA) was tested (sweet odor); n = 6 control, n = 9 asthmatic subjects. (B) The bar graph represents relative mRNA expression of OR2AG2 in normal human subjects (control) and asthmatic patients (Asthma), using Real time-PCR., n = 6 asthmatics and n = 10 normal subjects. (C) The representative western blot showing a decrease in the protein level of OR2AG2 in human alveolar epithelial cell line (A549), induced with rIL-13 for 24 hours. (D) The representative western blot showing decrease in the protein level of OR2AG2 in human lung fibroblast cells (HFL1), induced with rIL-13 for 24 hours. (E,F) Densitometric quantification of the experiment performed in (C,D) respectively, values are normalized to α-tubulin levels. All results are expressed as the mean ± SEM. *P < 0.05 and **P < 0.01 (t-test).

