Figure 4.
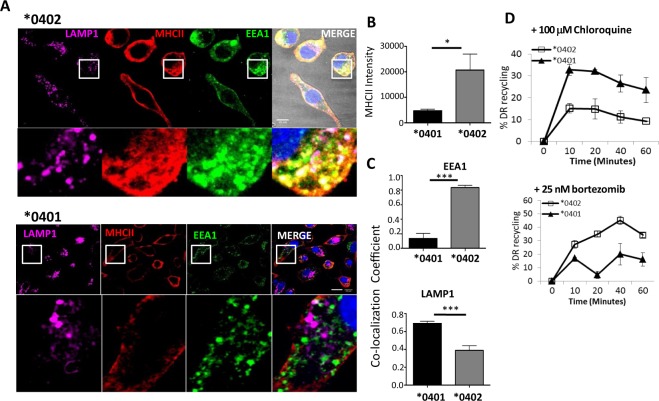
*0401 is localized to lysosomes and *0402 to early endosomes during recycling. (A) 3 D confocal microscopy image showing BMDCs from *0401 and *0402 mice stained for DR (MHCII), early endosomal antigen (EEA1) and lysosomal associated membrane protein 1 (LAMP1). (B) Quantification of MHCII integrated intensity from images in (A) using FIJI (NIH). (C) Images were analyzed for MHCII co-localization with (top) EEA1 and (bottom) LAMP1 using Pearson’s co-localization coefficient in ZEN (Carl Zeiss). Zoomed images are demarcated by white boxes. For each condition, >20 individual cells were imaged. Scale bars, 10 µm. Data represent mean ± SEM (n = 3 mice per group). MHCII recycling in BMDCs treated with (D) lysosome inhibitor, Chloroquine, and (E) protease inhibitor, Bortezomib. Data represent mean ± SEM (n = 3 mice per group) from two independent experiments, P < 0.05.

