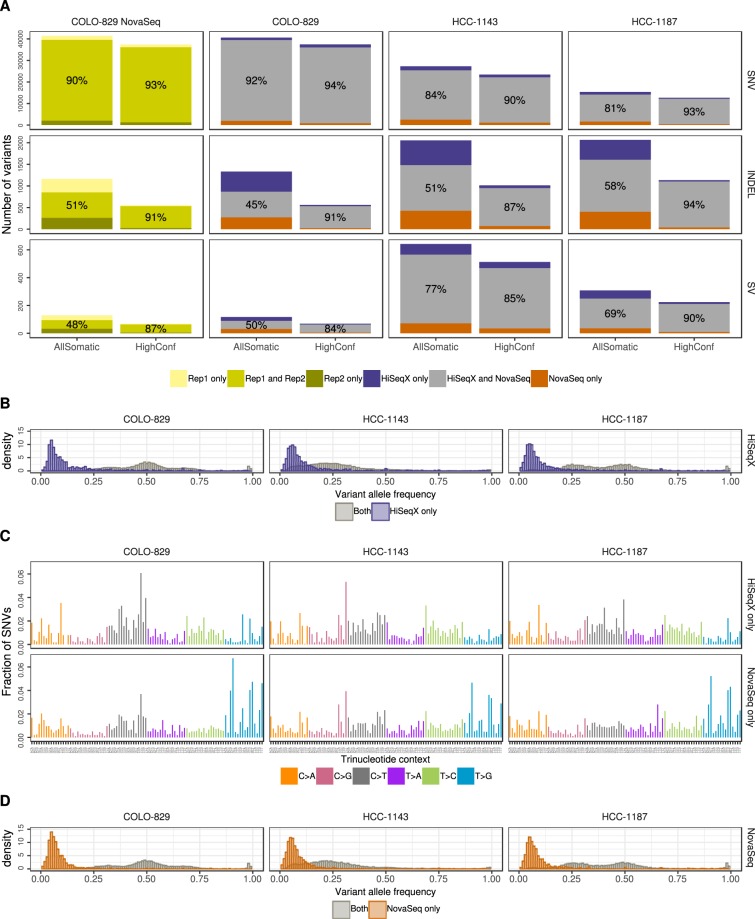
Figure 2.
Intra- and inter-platform comparison of somatic variants. (A) Comparison of SNVs, Indels and structural variants between two replicates COLO-829 NovaSeq data (created using reads from mutually exclusive lanes) and between HiSeqX and NovaSeq data for the three cell lines. Orange bars (resp. purple) represent the number of variants called uniquely in the NovaSeq runs (resp. HiSeqX) and the grey bars correspond to the variants called in both samples. The numbers in the grey bars represent the concordance between the two samples, calculated as percentage of the (number of variants in the intersect)/(number of variants in the union). (B) Allele frequency of the variants called only in HiSeqX in purple, and for reference the allele frequency of variants called in both platforms in grey. (C) The decomposition in trinucleotide contexts of the SNVs called uniquely by each platform. Substitutions are represented by the pyrimidine of the mutated Watson-Crick base pair. (D) Similar to panel B but for variants uniquely called in NovaSeq. The AllSomatic callsets were used for panels B, C and D.

