Figure 1.
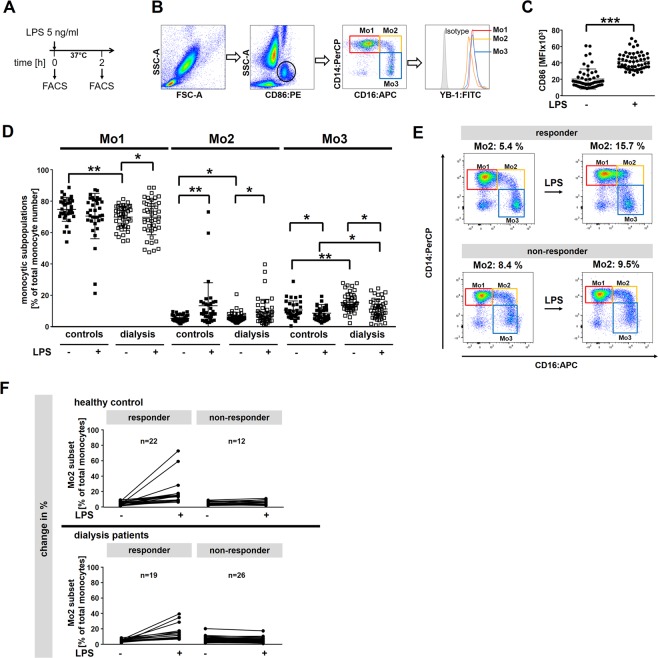
Response of monocytes from healthy controls and hemodialysis patients upon LPS stimulation. (A) Experimental design is shown. Whole blood from healthy controls (n = 34) and dialysis patients (n = 45) was incubated with 5 ng/ml LPS for 2 hours or left untreated. (B) Cells were analyzed by flow cytometry using the FlowJo Software. Monocytes were gated in a SSC/CD86+ dot plot identifying monocytes as CD86+ cells with monocyte scatter properties. Monocyte subpopulations (Mo1, Mo2, Mo3) are defined according to their surface expression pattern of the LPS receptor CD14 and the Fcγ receptor CD16. Histogram analysis was used to identify intracellular YB-1acetyl content in the respective monocyte subpopulations. (C) Scatter plot illustrating the enhanced CD86 expression on leukocytes following LPS stimulation. (D) Scatter plots illustrating the distribution of monocyte sub-populations Mo1-Mo3 following LPS stimulation in dialysis patients versus healthy controls. (E) Representing examples of CD14/CD16 dotplots defining the responder and non-responder group. (F) Diagram representing the change of Mo2 distribution following LPS stimulation in healthy controls and dialysis patients. Positive response was defined with a change of > 10% cells following LPS. Samples/patients with a change of Mo2 cells of less < 10% were classified in the non-responder group. (level of significance: *p < 0.05; **p < 0.005).

