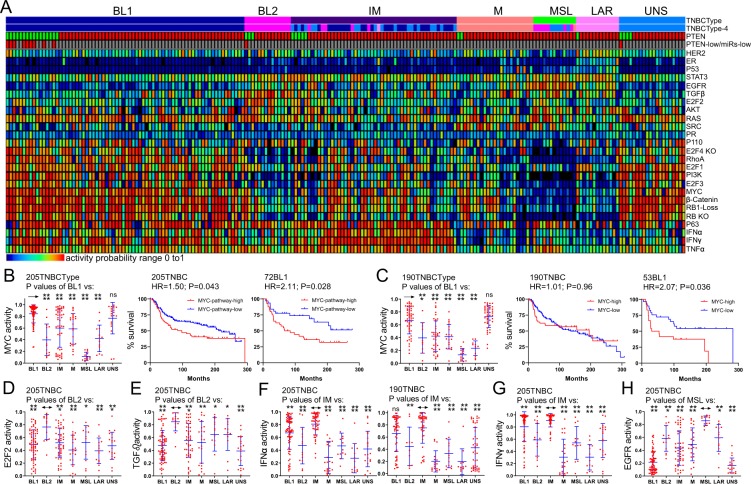
Figure 2.
Identification of signaling pathways that are altered in each specific TNBC subtypes. (A) Classification of 205 TNBCs into subtypes, and activity of 25 different signaling pathways. (B,C) In both training and validation sets high MYC pathway activity alone stratifies BL1 TNBC into high and low risk groups. (D,E) E2F2 and TGFβ pathways are significantly elevated in BL2. (F,G) IFNα and IFNγ pathways are significantly induced in IM. (H) EGFR activity is significantly higher in MLS compared to all other TNBC subtypes. Only IFNα signalling affected clinical outcome (Supplemental Fig. 1).

