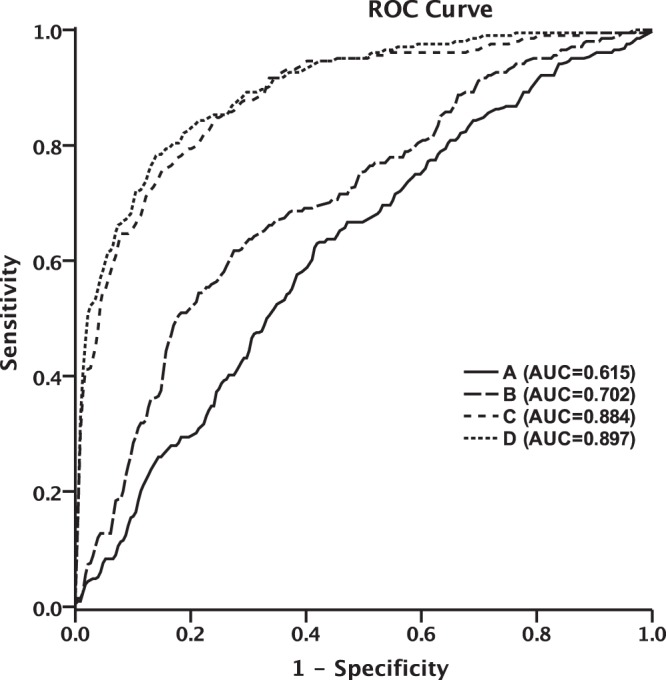
Figure 1.

The ROC curve analysis of different glycemic levels for predicting poor clinical outcome. (A) ROC curve analysis of elevated RBG for predicting poor outcome (P < 0.001, AUC = 0.615); (B) ROC curve analysis of elevated FBG for predicting poor outcome (P < 0.001, AUC = 0.702); (C) ROC curve analysis of gender, age, history of hypertension, diabetes mellitus, history of dyslipidemia, anticoagulant or antiplatelet therapy, smoking, drinking, BMI, baseline systolic blood pressure, GCS score, NIHSS score, baseline hematoma location and volume, intraventricular extension, surgical treatment, pre-stroke and post-stroke hypoglycemic treatment, for predicting poor outcome (P < 0.001, AUC = 0.884). (D) ROC curve analysis of RBG and FBG, combined with gender, age, history of hypertension, diabetes mellitus, history of dyslipidemia, anticoagulant or antiplatelet therapy, smoking, drinking, BMI, baseline systolic blood pressure, GCS score, NIHSS score, baseline hematoma location and volume, intraventricular extension, surgical treatment, pre-stroke and post-stroke anti-hyperglycemic therapy, for predicting poor outcome (P < 0.001, AUC = 0.897).
