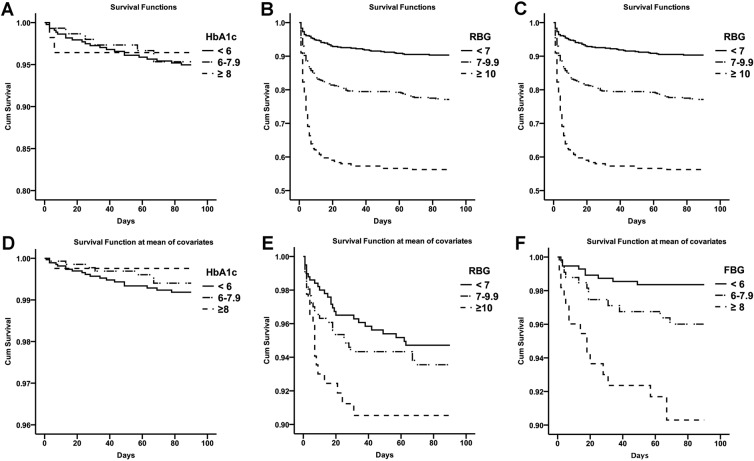
Figure 2.
Kaplan-Meier curve and Cox regression analysis of different glycemic levels for survival. (A–C) Kaplan-Meier curve (log-rank test) demonstrated that there were significant differences among three survival curves of FBG (P < 0.001, HR (fair/perfect) = 3.01, HR (poor/perfect) = 6.81) and RBG (P < 0.001, HR (fair/perfect) = 2.56, HR (poor/perfect) = 5.66), but no significant difference among three survival curves of HbA1c (P = 0.893); (D–F). Cox regression analysis demonstrated that there were still significant differences among three survival curves of FBG (P = 0.042) and RBG (P < 0.001) when adjusted for gender, age, history of hypertension, diabetes mellitus, history of dyslipidemia, anticoagulant or antiplatelet therapy, smoking, drinking, BMI, baseline systolic blood pressure, GCS score, NIHSS score, baseline hematoma location and volume, intraventricular extension, surgical treatment, pre-stroke and post-stroke anti-hyperglycemic therapy.

