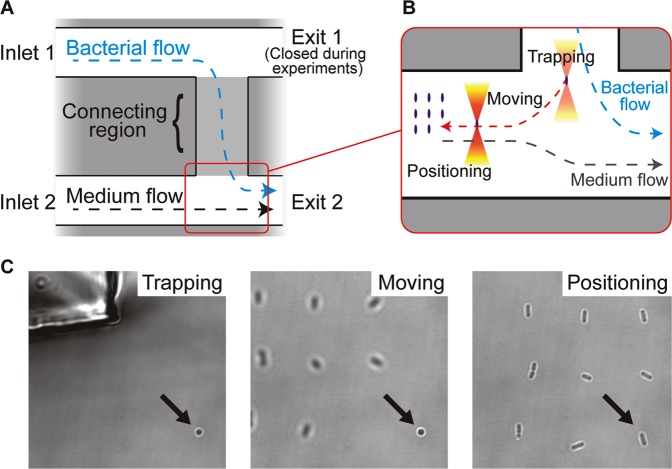
Figure 1.
Microfluidic chip and optical trapping procedure. (A) Layout of the microfluidic chip, with indicated flow directions of medium and bacterial culture. (B) In all experiments, the procedure commenced with optical trapping of single E. coli bacteria near the connecting region and moving the trapped cells into the channel with flow of fresh medium. In experiments testing the survivability after optical trapping, cells were then held until they had been exposed to a predefined dose of IR light and thereafter positioned on the silanised cover glass. When testing the stability of the optical trapping, the flow rate in the medium channel was gradually increased and the flow rate at which the cell was lost from the trap was recorded. (C) Bright field images corresponding to the steps shown in (B). Here, a bacterium (indicated with an arrow) held with a stationary trap was moved into the medium channel. Just before positioning, oscillation of the trap was initiated to align the cell along the focal plane. Then, the trap was moved down to the surface of the silanised cover glass, so that the trapped cell was positioned on the cover glass with the long cell axis visible for imaging.

