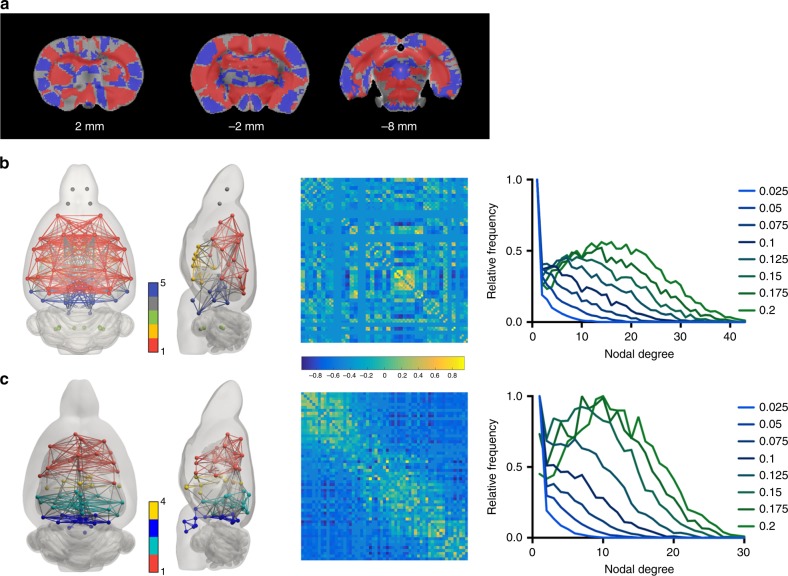
Fig. 7. Functional connectivity analysis performed with anatomical or functional atlas.
a Significant differences (p < 0.05, non-parametric permutation-based group comparison with a Student t-test, corrected for multiple comparisons using Family Wise Error) in the voxel-mean ROI signal variability. Red represents reduced variability using the functional atlas while blue represents increased variability. Functional connectomes built with b the SIGMA anatomical atlas and c the SIGMA functional atlas. Each module within the network is coded by the node color. Shown here are the average networks visualized using BrainNet Viewer (left), the average connectivity matrices (center) and the plots of the degree distribution for densities between 0.025 and 0.2. (t = 0.41, df = 78, p = 0.68, two sample Student t-test). Source data are provided as a Source Data file.

