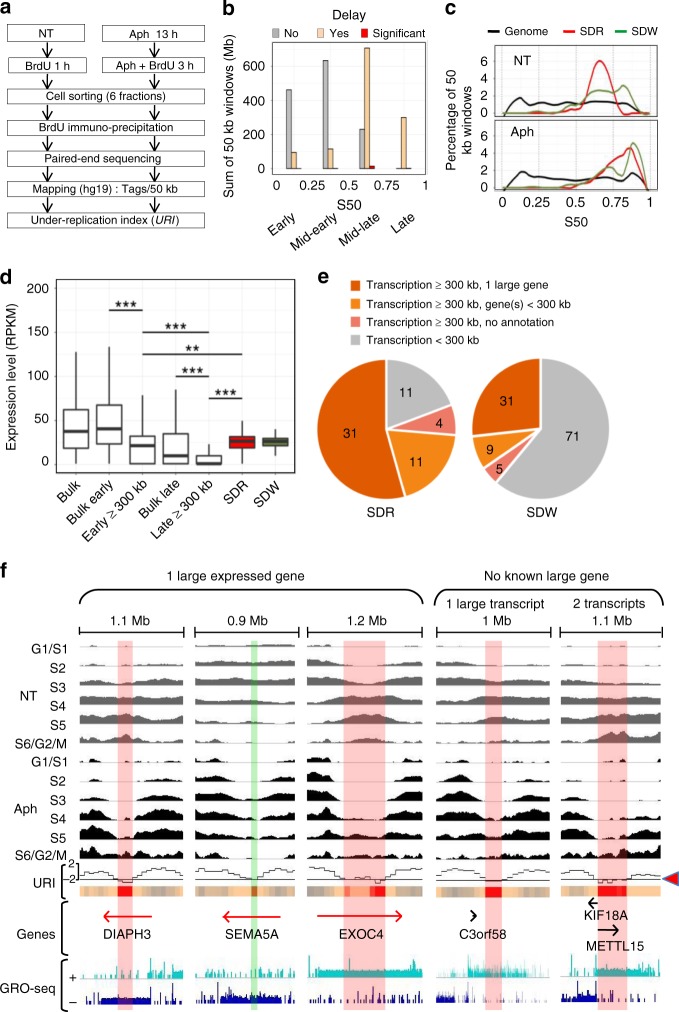
Fig. 1. Genomewide profiling of replication timing identifies SDRs/SDWs.
a Scheme of Repli-Seq experiments with untreated (NT) and aphidicolin-treated (Aph) lymphoblasts. The Under-Replication Index (URI) was calculated at 50 kb resolution (ΔAph-NT, Methods). b Histogram showing the sum of 50 kb windows (in Mb) displaying no delay (URI > 0, n = 26,558, 1328 Mb), low-to-moderate delay (−2 < URI < 0, n = 24,343, 1217 Mb), or significant delay (URI < −2, P < 0.05, n = 330, 16.5 Mb) upon Aph treatment in four timing classes (defined by the S50 on a scale from 0 to 1). c Percentage of 50 kb windows in SDRs (n = 57), isolated SDWs (n = 116), and along the genome (n = 56,783) as a function of S50. These percentages were computed within each bin (bin size = 0.01) then Loess smoothed (α = 0.25). For SDRs, the values correspond to the mean timing of all 50 kb windows in each SDR. d Boxplot (bounds of box: 25th and 75th percentiles; centre line: median) showing the gene expression level distribution relative to their replication timing. For genes > 50 kb, the timing values correspond to the mean timing of all 50 kb windows enclosed in each gene. The expression levels (RPKM, Methods) were measured by GRO-Seq29 for all expressed genes (Bulk, n = 15,204), all early-replicating (S50 < 0.5, n = 13,257), all late-replicating (S50 ≥ 0.5, n = 1947), the subset of early-replicating (n = 315) or late-replicating (n = 304) genes ≥ 300 kb free of SDR/SDW, and for genes harbouring an SDR (n = 54) or an SDW (n = 39) (Kolmogorov–Smirnov test: **P < 0.01; ***P < 0.001). e Pie-chart showing the numbers of SDRs or SDWs associated with the indicated classes of transcripts. f Representative examples of SDRs/SDWs nested in large transcribed domains. The Repli-Seq profiles (NT and Aph) were normalized to the same background level (Methods). The URI profile is shown with red arrowhead pointing to −2 threshold (Methods), aligned with the corresponding heat-map (colours as in b). Genes and the GRO-Seq profiles on the Watson (+) and Crick (−) strands are shown. The SDRs (red vertical bars) and SDW (green vertical bar) are indicated. The genomic regions displayed are from left to right: chr13:61-61.1; chr5:8.8-9.7; chr7:132.8-134; chr3:143.4-144.4; chr11:27.7-28.9 Mb. Source data are provided as a Source Data file.

