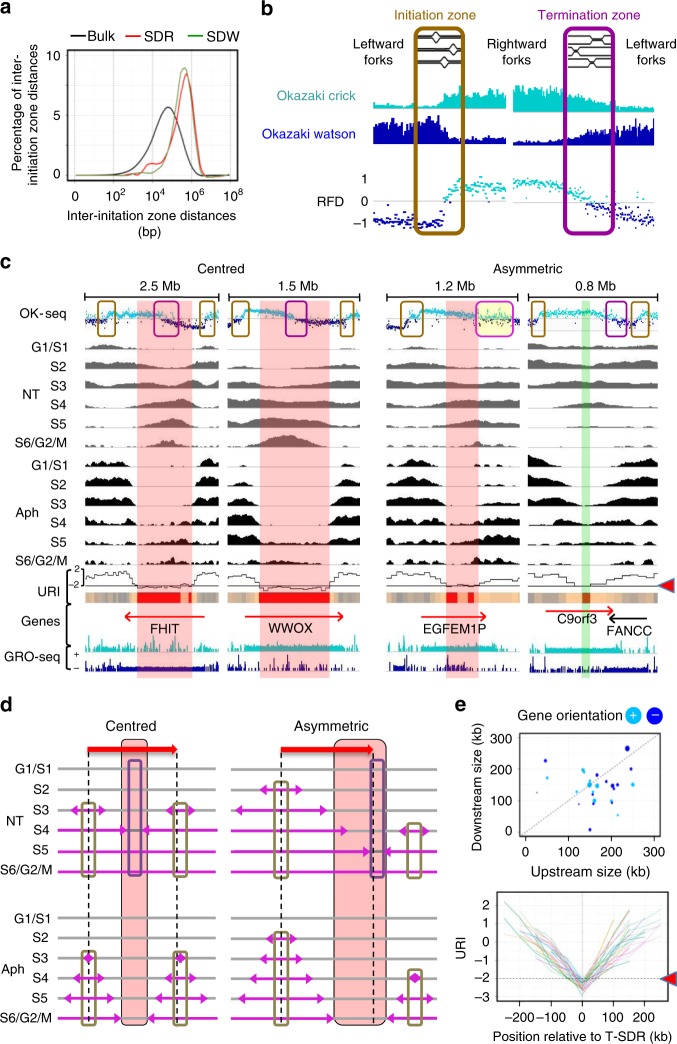
Fig. 2. T-SDR/SDW localization relies on the properties of flanking initiation zones.
a T-SDRs/SDWs are poor in initiation events. Percentage of inter-initiation zone distances identified by Bubble-Seq30 for the bulk genome and regions overlapping SDRs or SDWs. The percentages were computed as in Fig. 1c with bin size = 0.1. b Determination of replication fork directionality (RFD) by Okazaki fragment sequencing (Ok-Seq). Each point shows the RFD value, computed (in 1 kb windows) as the difference between the proportions of forks moving rightward (fragments mapping on the Crick strand) or leftward (fragments mapping on the Watson strand). Upward (downward) transitions correspond to initiation (termination) zones31. c Representative examples of genes ≥ 300 kb (red arrows) displaying a centred (left panels) or an asymmetric (right panels) termination zone. The initiation and termination zones are highlighted by orange and purple boxes on the OK-Seq profiles, as in b, the yellow-filled box corresponds to a large zone showing complex RFD pattern with both initiation and termination events. Repli-Seq, URI and GRO-Seq profiles, and T-SDRs/SDWs, are as in Fig. 1f. From left to right, regions are chr3:59-61.5; chr16:77.9-79.5; chr3:167.6-168.9; chr9:97.4-98.2 Mb. d Scheme depicting how initiation poor regions nested in a large gene body elicit under-replication upon fork slowing. Pink arrows: replication forks. Red arrows and vertical dotted lines: genes. Initiation and termination zones, and the T-SDRs/SDWs are represented as above. Left: initiation zones with comparable firing times and efficiencies flank the large gene. Right: the flanking initiation zones display different firing time and localization relative to the 5′- and 3′-ends of the gene. e Upper panel: dot-plot showing the distances separating the transcription start site from the upstream end (Upstream size) and the transcription termination site from the downstream end (Downstream size) of the T-SDR (n = 46). The circle sizes are proportional to the gene lengths. Genes on the + or – strand are indicated (light and dark blue, respectively). Lower panel: each colour line shows the URI profile of the upstream and downstream (negative and positive values on the x axis, respectively) regions flanking each individual T-SDR. Source data are provided as a Source Data file.

