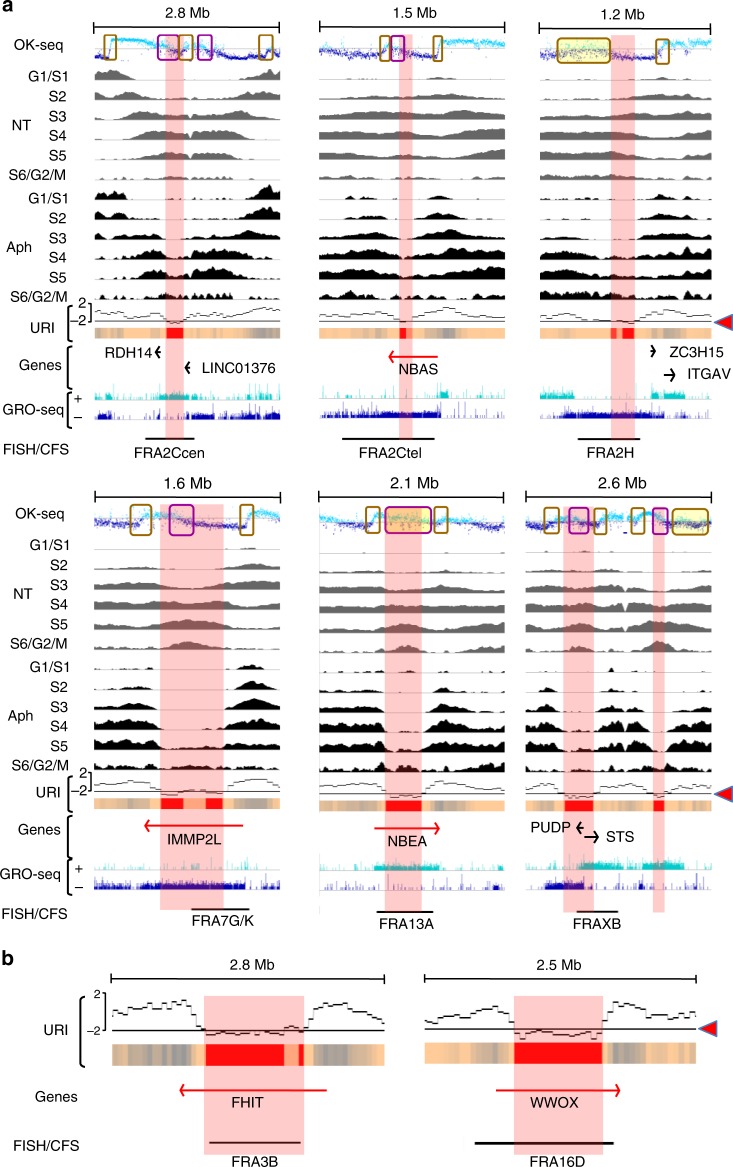
Fig. 3. T-SDR/SDWs colocalize with CFSs fine-mapped by FISH.
a T-SDRs/SDWs positioning relative to the instable regions. OK-Seq, Repli-Seq and GRO-Seq profiles, and T-SDRs/SDWs (presented as in Fig. 2c) are shown along regions hosting the indicated genes/CFSs. These sites were chosen, because they display a break frequency ≥ 1% in normal lymphocytes32 and have been fine-mapped by FISH (black bars) in lymphocytes19. The T-SDRs/SDWs are included in, or at least partially overlap, the instable regions. The genomic regions displayed are as follows: chr2:17.8-20.6 Mb; chr2:14.7-16.3 Mb; chr2:186.4-187.9 Mb; chr7:109.8-111.5 Mb; chr13:34.9-37 Mb; chrX:6.2-8.9 Mb. b T-SDRs positioning relative to the instable regions hosting FHIT/FRA3B and WWOX/FRA16D relative to the URI profiles. The genes, URI profiles, T-SDRs/SDWs and instable regions mapped by FISH are presented as in a. Source data are provided as a Source Data file.

