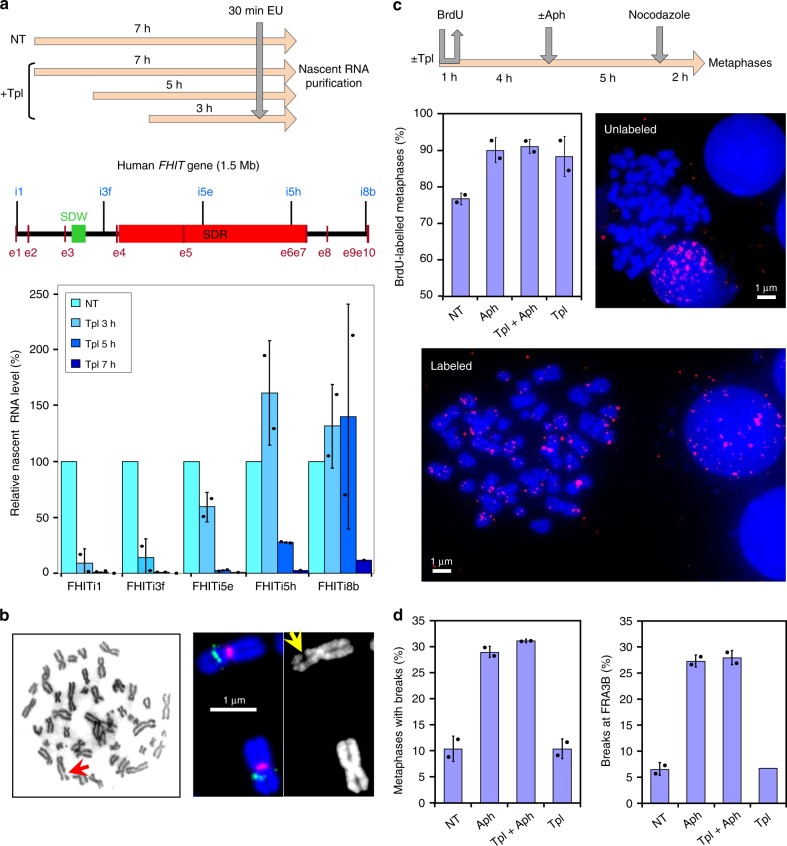
Fig. 4. Short-term inhibition of transcription by triptolide does not impact CFS instability.
a Determination of the minimal time permitting clearing of the FHIT gene from ongoing transcription. Upper panel: scheme of the experiments. Untreated cells (NT) and cells treated with 1 μM triptolide (Tpl) for the indicated periods of time were pulse labelled with EU for 30 min before recovery. Nascent RNAs were prepared by the Click-It method and quantified by RT-qPCR. Middle panel: map of the human FHIT gene with the position of exons (e1–e10), T-SDW/SDR and intronic primer pairs (i1–i8b) used for quantification. Lower panel: quantification of nascent RNA along FHIT at the different times of Tpl treatment. b Examples of chromosome breaks in cells treated with 600 nM Aph for 7 h. Left panel: metaphase plate displaying a break (red arrow) on Giemsa-stained chromosomes. Right panel: break at FRA3B (yellow arrow) visualized after DAPI staining and FISH with probes specific to the FHIT gene (green) and to the centromere of chromosome 3 (red). Contrast of DAPI-stained chromosomes (rightmost panel) was enhanced to better show the break. c Upper panel: scheme of the experiments: cells were treated with 1 μM triptolide and 600 nM Aph, alone or in combination, for the indicated times before metaphase preparation. In all conditions, cells were pulse labelled for 1 h with 30 µM BrdU at the beginning of the experiments and treated for 2 h with 200 nM nocodazole at the end of experiments to enrich the populations in metaphase cells. Lower panels: the fraction of BrdU-labelled metaphases was scored after DAPI staining and immunofluorescence revelation with anti-BrdU antibodies. Examples of BrdU-labelled and unlabelled metaphases are shown. Note also the presence of labelled and unlabelled interphase nuclei. d Determination of the frequencies of total chromosome breaks (left panel) and breaks at FRA3B (right panel). Breaks were scored as in b. Experiments shown in a, c and d were carried out twice and the error bars represent the SD. Source data are provided as a Source Data file.

