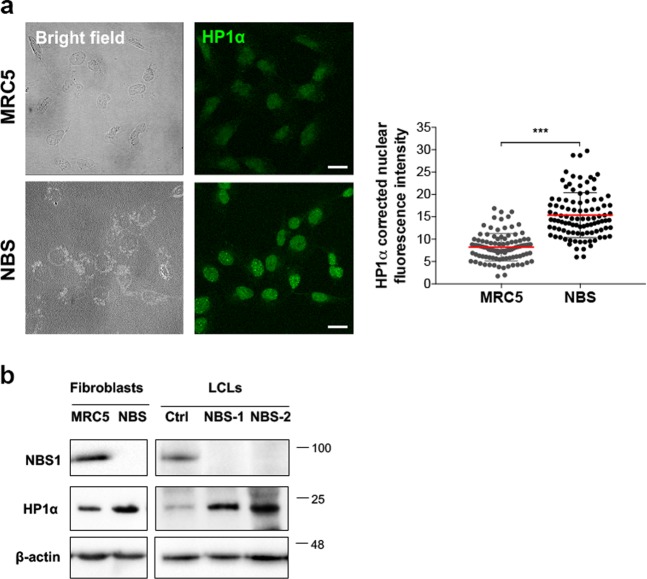
Fig. 6. HP1α accumulates in NBS cells.
a Left: representative images of the immunofluorescence analysis of HP1 levels (green) in MRC5 and NBS cells. Bar: 20 μm. Right: Distribution of HP1α corrected nuclear fluorescence intensity in MRC5 and NBS1 cells. The horizontal lanes indicate the mean values derived from the analysis of 100 cells/experimental point in three independent experiments ±S.D. (t Student’s Test; ***p < 0.001). b WB analysis of HP1α levels in fibroblast and lymphoblastoid cells (LCLs). The levels of HP1α and NBS1 in NBS cells were compared to their corresponding controls (i.e., MRC5 for NBS1 fibroblasts; Ctrl for NBS1–1 and NBS1–2 lymphoblastoid cells); β-actin was used as the loading control.

