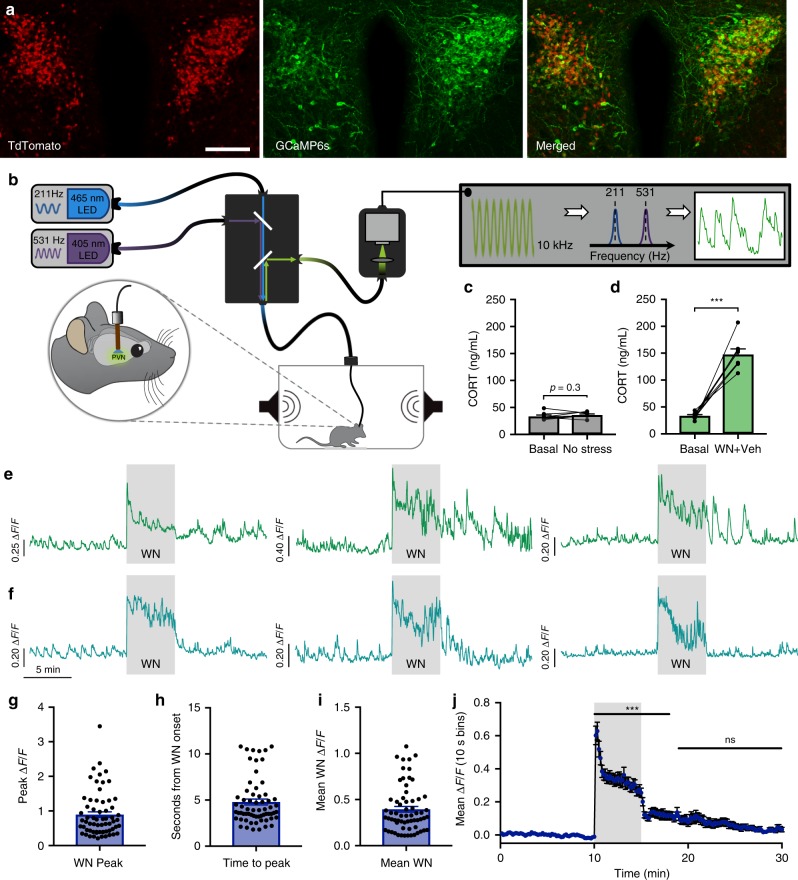
Fig. 1. Optical recordings of CRH neuron activity in freely behaving mice.
a Image showing PVN expression of CRH-tdTomato reporter (left), AAV-driven GCaMP6s (center), and merged image (right). Scale bar: 100 μm. b Schematic illustration of the fiber photometry setup. c Blood CORT concentrations obtained from tail tip samples, while mice remained within experimental testing box in the absence of white noise (WN) stress; n = 8, p > 0.05, paired t test. d Blood CORT concentrations following WN stress; n = 8, ***p < 0.001, paired t test. e Photometry recordings of CRH neurons from three individual mice displaying continued activity after termination of WN. f Photometry recordings of CRH neurons from three individual mice displaying rapid cessation of activity after termination of WN. g Peak ΔF/F at WN stress onset, n = 64. h Time to peak from the onset of WN onset, n = 64. i Mean ΔF/F of CRH neuron activity during 5 min WN stress from all individual mice tested, n = 64. j Mean CRH neuron ΔF/F in 10 sec bins from all individual mice; n = 64, repeated-measures (RM) one-way ANOVA ***p < 0.001 vs. baseline, Dunn’s post hoc test. All data are presented as mean ± SEM.

