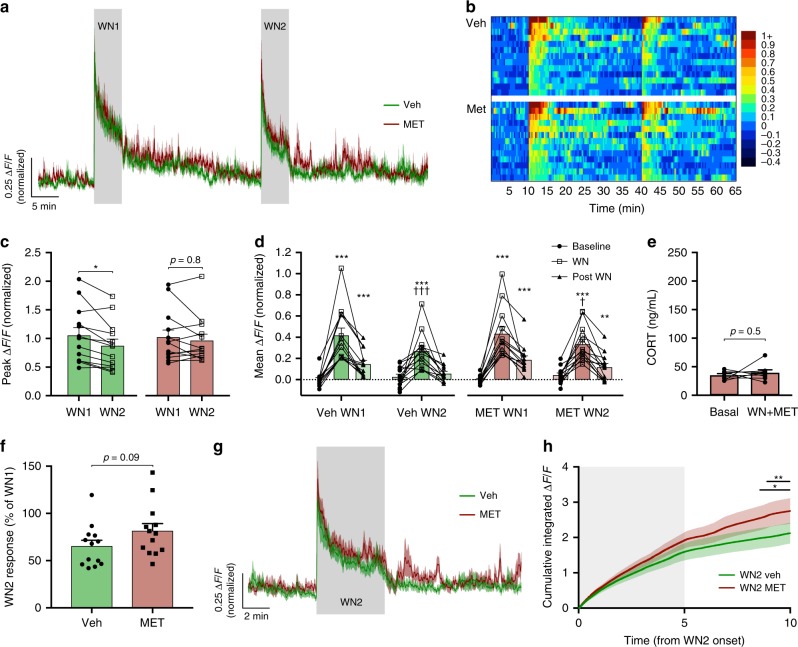
Fig. 2. CRH neuron shut-off and adaptation occur regardless of fast CORT feedback.
a Mean photometry signals of CRH neuron activity induced by two sequential WN stressors 30 min apart from vehicle and metyrapone-treated mice. b Heatmap of mean CRH neuron activity from all individual mice in 20 s bins. c Peak ΔF/F at WN onset; RM two-way ANOVA, *p < 0.05 vs. WN1, Holm–Sidak; ANOVA interaction p = 0.14, ANOVA main effect of group p = 0.86. d Average ΔF/F across 5 min of CRH neuron activity before, during, and after each WN; n = 13 per group, RM two-way ANOVA, *p < 0.05 vs. baseline, †p < 0.05 vs. respective WN1 timepoint, Holm–Sidak; ANOVA interaction p = 0.90, ANOVA main effect of group p = 0.38. e CORT levels before and after WN stress following metyrapone treatment; n = 8, paired t test. f Percentages of CRH neuron activity during WN2 relative to WN1; Veh vs. MET, Mann–Whitney test. g Averaged photometry recordings of CRH neuron activity from all vehicle and metyrapone-treated mice showing the response to WN2. h Cumulative integrated ΔF/F from the time of WN2 onset; RM two-way ANOVA, *p < 0.05 Veh vs. MET, Holm–Sidak; ANOVA interaction p < 0.001, ANOVA main effect of group p = 0.09. Lines indicate points at which statistical significance was reached and its duration. Gray shaded area indicates duration of WN. All data are presented as mean ± SEM, */†p < 0.05, **/††p < 0.01, ***/†††p < 0.001.

