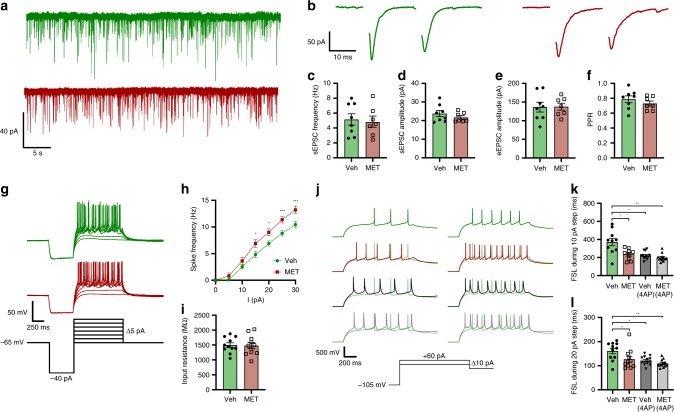
Fig. 6. CORT feedback increases first spike latency and decreases spike output.
a Traces of sEPSC from individual CRH neurons from vehicle (green) or metyrapone- (red) treated mice. b Traces of paired-pulse eEPSC amplitudes from CRH neurons from vehicle (green) or metyrapone- (red) treated mice. c Mean sEPSC frequency; unpaired t test, p = 0.8. d Mean sEPSC amplitudes; unpaired t test, p = 0.3. e Mean eEPSC P1 amplitudes; unpaired t test, p = 0.9. f Paired pulse ratio (PPR); Mann–Whitney test, p = 0.3. g Traces of CRH neuron spike output from vehicle (green) or metyrapone- (red) treated mice in response to varying current steps. h Spike frequency plotted for each 5 pA step; n = 11 per group, RM two-way ANOVA, *p < 0.05 vs. vehicle, Holm–Sidak; ANOVA interaction p = 0.09, ANOVA main effect of group p < 0.001. i Input resistance from individual CRH neurons; unpaired t test, p = 0.9. j CRH neuron responses to 10 pA (left) and 20 pA (right) current steps with or without prior incubation with 4AP (Veh + 4AP in black, MET + 4AP in gray). k, l FSL during 10 pA (k) and 20 pA (l) steps from vehicle and metyrapone-treated mice with or without 4AP incubation. RM two-way ANOVA *p < 0.05 Holm–Sidak; ANOVA interaction p = 0.003, ANOVA main effect of group p < 0.001. All data are presented as mean ± SEM, *p < 0.05, **p < 0.01, ***p < 0.001.

