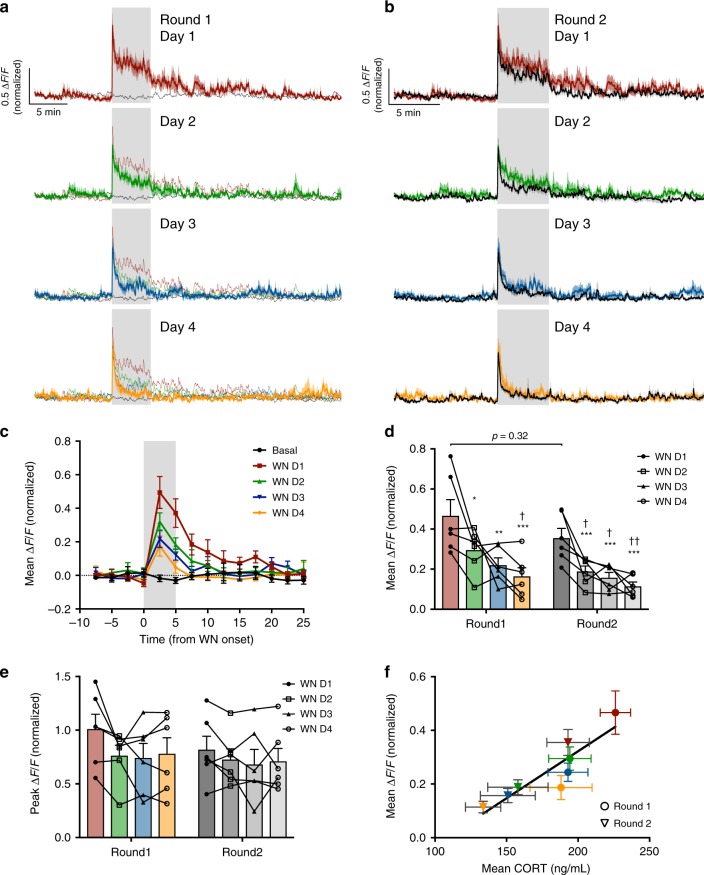
Fig. 8. Long-term adaptation of CRH neural activity to stress.
a Mean photometry signals of CRH neuron activity from mice receiving daily WN stress over 4 days (round 1: day 1; red; day 2, green; day 3, blue; day 4, orange). Black trace indicates mean CRH neuron activity from the same cohort of mice on day 0, in the absence of WN. b Mean photometry signals of CRH neuron activity from the same mice after a 3-week rest interval (with no stress) and then subsequently receiving daily WN stress over 4 more days (round 2: all recordings in black overlaid with corresponding round 1 WN response). c Mean ΔF/F changes in response to each WN or no stress (black) in 2.5 min bins during round 1. d Average ΔF/F of CRH neuron activity during WN stress across the two rounds of repeated stress; n = 6, RM two-way ANOVA, *p < 0.05 vs. round 1 WN day 1, †p < 0.05 vs. round 2 WN day 1, Holm–Sidak; ANOVA interaction p = 0.77, ANOVA main effect of group p = 0.09. e Peak ΔF/F at WN onset across the two rounds of repeated stress; RM two-way ANOVA, Holm-Sidak; ANOVA interaction p = 0.53, ANOVA main effect of group p = 0.60. f Correlation of mean CRH neuron activity during WN and corresponding post-stress blood CORT concentration across the two rounds (round 1 in circles and round 2 in triangles, 4 days of WN indicated by corresponding color; Pearson’s r = 0.90, r2 = 0.8. All data presented as mean ± SEM, */†p < 0.05, **/††p < 0.01, ***/†††p < 0.001.

