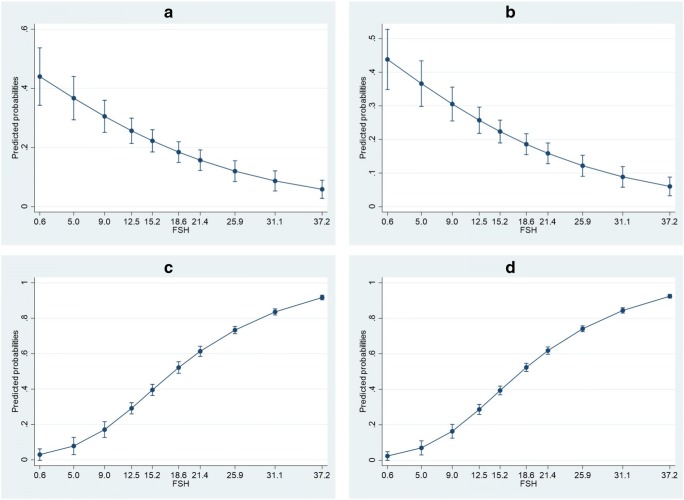
Fig. 2.
Binary logistic regression plots. a Development set with HYPO as outcome variable. b Validation/redevelopment set with HYPO as outcome variable. c Development set with SCO as outcome variable. d Validation/redevelopment set with SCO as outcome variable. X axis displays the lowest limits of FSH deciles; FSH deciles ranges are displayed in Supplementary Table 3. Adjusted predictions are displayed with 95% CI

