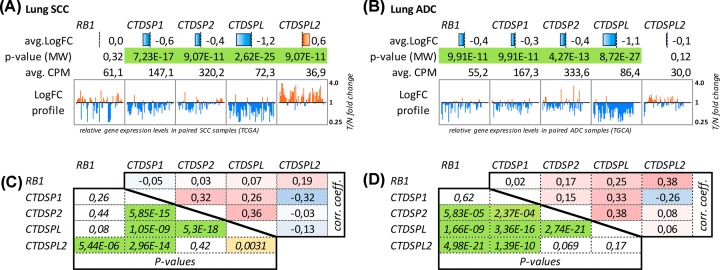
Figure 1. Analysis of RB1 and SCP subfamily genes expression in lung cancer (TCGA data).
(A) SCC and (B) ADC. Avg. LogFC – binary logarithm of average expression level fold change (T/N, tumor versus adjacent normal tissue); avg. CPM – average read counts per million (pooled tumor and normal samples), which reflects the absolute gene expression level; P-value (MW) – statistical significance of T/N expression differences according to Mann–Whitney U-test; LogFC profile – T/N expression ratio (axis is geometrically log-transformed) across individual paired samples; (C,D) Co-expression of RB1 and SCP subfamily genes in lung cancer (TCGA data). Upper diagonals of the matrices show Spearman’s rank correlation coefficients; lower diagonals – Spearman’s P-values. Cell colors are linked to cell values.

