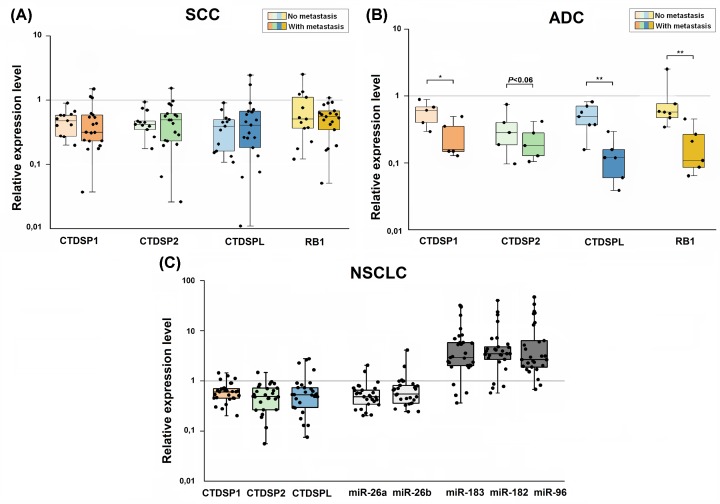
Figure 2. Quantitative real-time PCR analysis of CTDSP1/2/L, RB1 and microRNA expression in NSCLC.
(A,B) Relative CTDSP1/2/L and RB1 expression in metastatic and non-metastatic SCC (n=33) and ADC (n=13) normalized to RPN mRNA level. (C) CTDSP1/2/L, intronic miR26a/b, and miR-96/182/183 expression in NSCLC samples (n=28) normalized to RPN1, RNU6, and RNU48 expression, respectively. The boxes represent the interquartile ranges (25–75th percentiles); horizontal lines inside the boxes indicate the medians. The vertical whiskers extend to the maximum and minimum values. *P≤0.05; **P≤0.01 (Mann–Whitney U-test).

