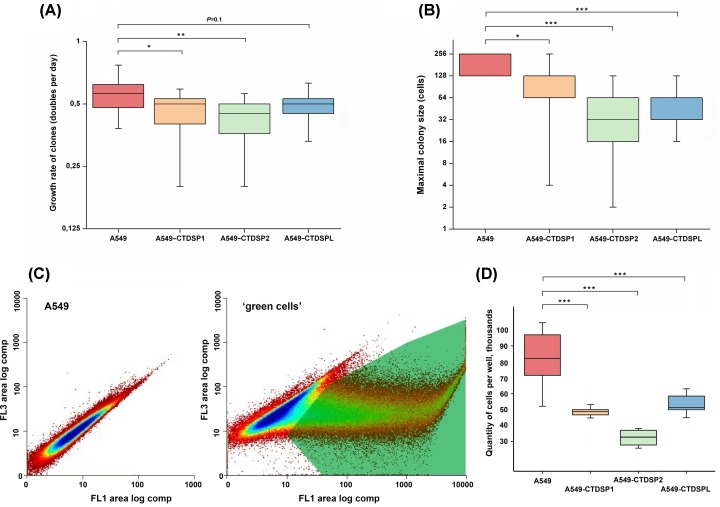
Figure 3. Suppression of the growth of A549 cells after transfection with CTDSP1/2/L.
(A) Growth rate of transfected clones. The boxes represent the interquartile range (25–75th percentiles); horizontal line inside the box indicates the median. The vertical whiskers extend to the maximum and minimum values. The gray line indicates the median value for non-transfected cells. (B) Distribution of the maximal sizes of colonies (colony formation assays). For A549 vertical whiskers are within the box. For A549, A549-CTDSP1 and A549-CTDSPL median coincides with the 25th percentile. (C) Fluorescence distribution of original A549 cells and transfected cells. FL3 (red) and FL1 (green). The gate for sorting is shown. (D) Suppression of ‘green’ cells growth, the box-and-whisker plot; the significance of differences of A549, transfected with the pSB100 plasmid only, is determined by the nonparametric Wilcoxon test. For (A,B,D), *P≤0.05; **P≤0.01; ***P≤0.001.

