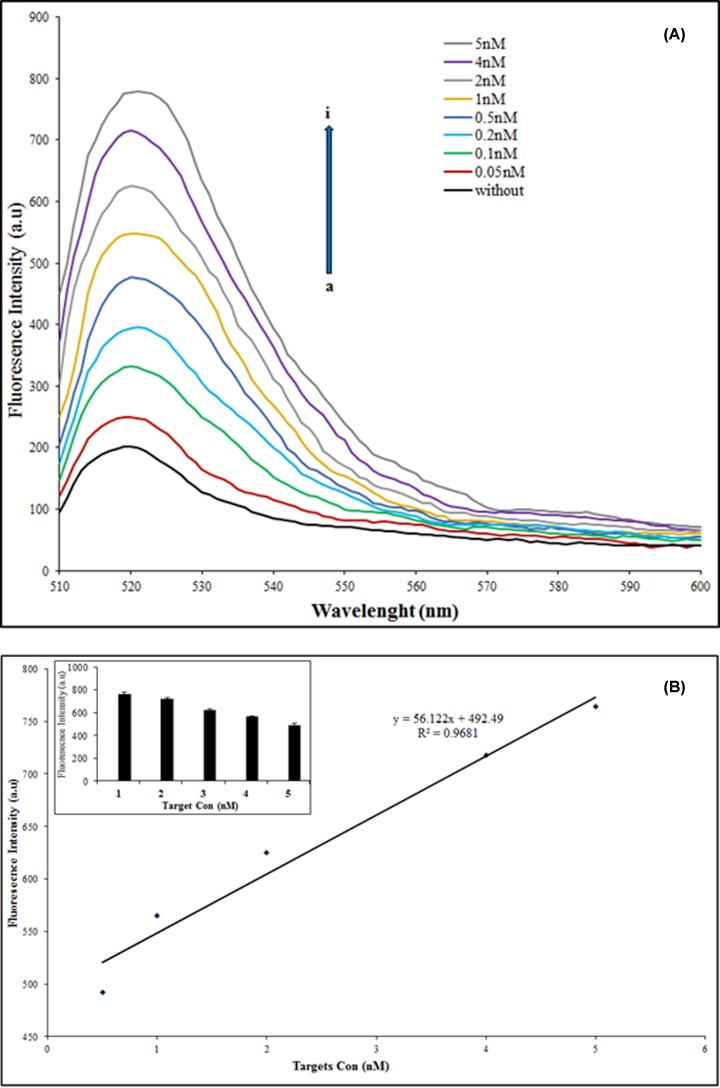
Figure 4. Sensitivity assessment of nanobiosensor.
(A) Fluorescence emission spectra in the presence of different concentrations of miRNA from 0.05 to 5 nM (a→i). (B) The linear relationship (R2 = 0.99) between the drawdown fluorescence intensity, in the presence of different concentrations of miRNA (0.5–5 nM). The inset graph shows the same results as histograms. The excitation wavelength was 490 nm.

