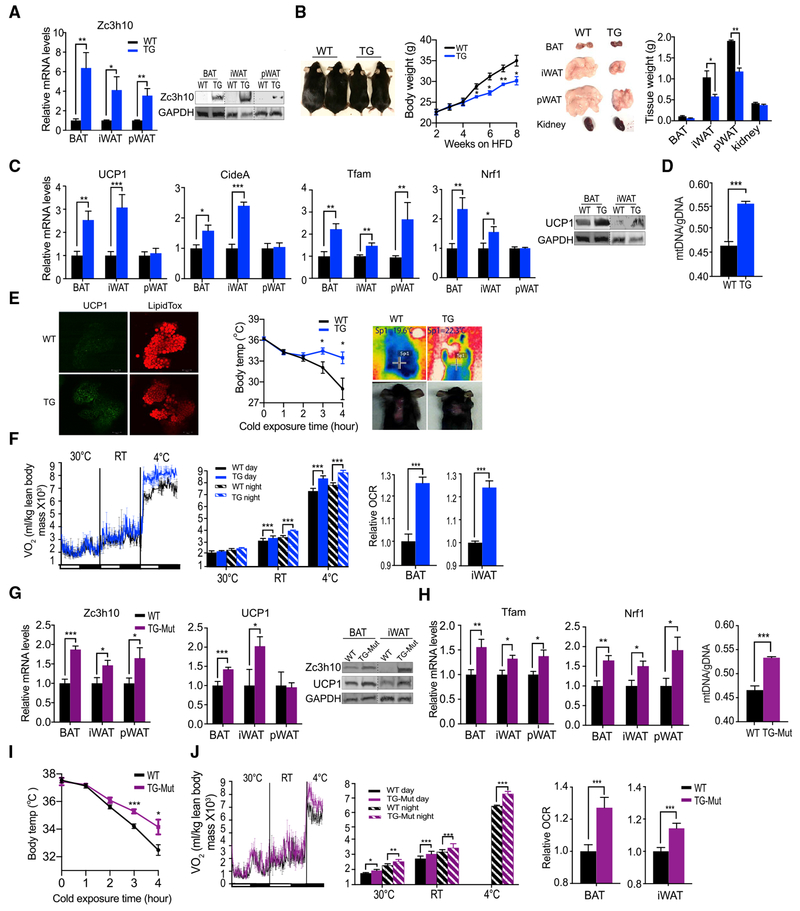
Figure 3. Overexpression Zc3h10 Promotes BAT Gene Program and Enhances Energy Expenditure, Preventing Diet-Induced Obesity.
(A) qRT-PCR/immunoblotting for Zc3h10 in adipose depots of WT and AQ-Zc3h10 mice (TG).
(B) Representative photograph and body weight of 16-week-old WT and TG mice fed high-fat diet (HFD) for 8 weeks (n = 5–6 mice per group).
(C) (Left) qRT-PCR for indicated genes in adipose depots of WT and TG mice housed at RT (n = 5-6 mice per group) (Right) Immunoblotting for UCP1 in BAT and iWAT.
(D) Quantification of mitochondria number in BAT (n = 12).
(E) (Left) Whole-mount immunostaining for UCP1 (green) and LipidTox staining (red) in BAT of 10-week-old mice. (Middle) Rectal temperature measured in 15-week-old mice at 4°C (n = 6 mice per group). (Right) Infrared thermography of 4-h cold-induced BAT activity; Sp1, temperature of specific area of BAT.
(F) (Left, middle) VO2 assayed in mice, housed at indicated ambient temperatures by indirect calorimetry using CLAMS (n = 5 per group). (Right) OCR measured in BAT and iWAT of mice using Seahorse XF24 Analyzer (n = 5).
(G) qRT-PCR/immunoblotting for Zc3h10 and UCP1 in various adipose depots of WT and TG-Mut, overexpressing Zc3h10-mutated RNA-binding domains, ZF1 and ZF2.
(H) (Left) qRT-PCR for indicated genes in adipose depots of WT and TG-Mut mice. (Right) Quantification of mitochondria number in BAT of WT and TG-Mut mice.
(I) Rectal temperature measured in 15-week-old mutant mice at 4°C at indicated time points (h) (n = 5–6 mice per group).
(J) VO2 assayed in WT and TG-Mut mice on CD, housed at indicated ambient temperature (n = 5–6 per group), measured by indirect calorimetry using CLAMS.
Data presented as mean ± SEM. *p < 0.05, **p < 0.01, ***p < 0.001. See also Figure S2.

