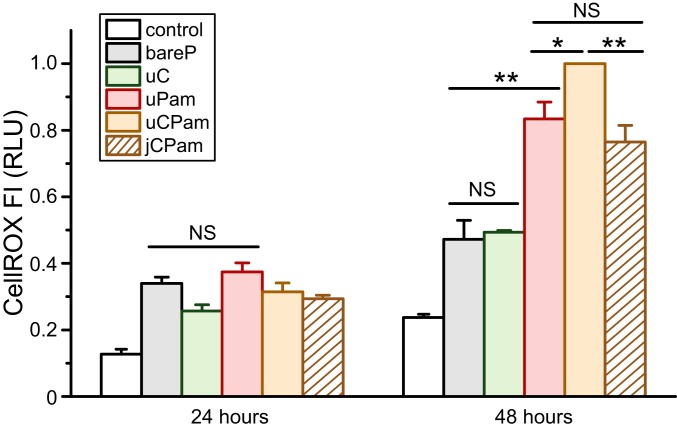
Fig. 5.
Measurement of ROS production in RAW264.7 macrophages upon stimulation with different particles and stained after 24 and 48 h. Each bar represents the mean and SE obtained from 3 independent experiments, each performed in triplicate. Statistical significance is highlighted by P values (Student’s t test) as follows: **P < 0.01; *P < 0.05; NS, not significant.

