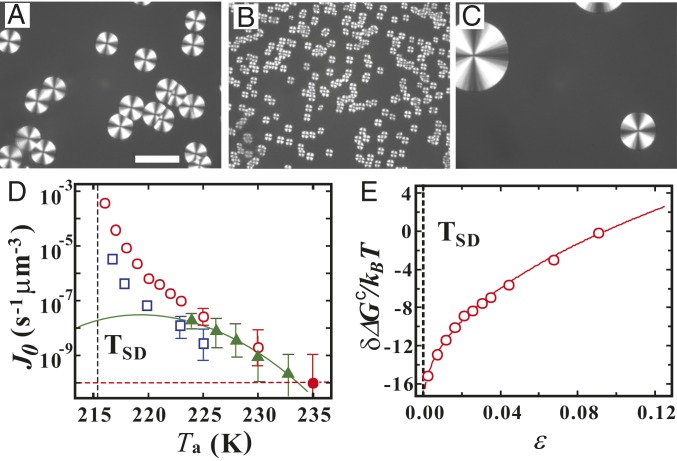
Fig. 3.
Enhancement of the crystal nucleation frequency near the spinodal temperature of LLT, . (A–C) Images show crystals observed with polarizing microscopy in TPP samples, which were first quenched to (A) K, (B) 217 K, and (C) 150 K and annealed there for 5 min, then heated to K with a rate of 100 K/min and annealed for 20 min. We stress that the crystallization always takes place at K. (Scale bar: , 20 ; also applies to and .) () The crystal nucleation rate at K (circles) and 240 K (squares) as a function of for a sample with fluctuations, which is annealed at for 5 min. The for the ordinary crystallization protocol is also shown by green triangles, together with the CNT prediction (green solid curve) (SI Appendix, section 3 and Fig. S3). This without fluctuations obeys the CNT prediction, as expected. The vertical black dashed line indicates the location of . For both s, for crystallization of a sample with fluctuations increases very steeply when . The filled red circle corresponds to for a sample directly quenched to 235 K from melt; that is, it corresponds to in absence of fluctuations at K. The horizontal red dashed line is the value of expected in the absence of LLT. For K, the number of crystal nuclei becomes very small, leading to a larger statistical error. The data are the crystal nucleation rate averaged over 10 times. The error bars are shown in the plot only when they exceed the size of the symbols (SI Appendix, section 2) () The difference between at 235 K and that at as a function of . The solid curve is a fit by with (see text).

