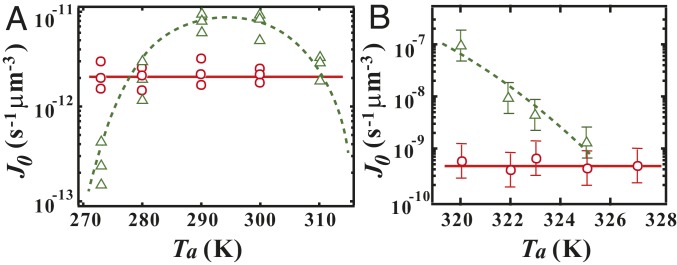
Fig. 4.
Effects of annealing on the crystal nucleation rate for ordinary liquids without LLT. () The rate of crystal nucleation in D-sorbitol. The triangles correspond to when the sample is crystallized at an annealing temperature . The dashed curve is the CNT fitting of the data, which are consistent with the results in ref. 44. On the other hand, the circle symbols represent the nucleation rates for a protocol in which a sample is annealed at for 1 h and then heated and crystallized at K. () The rate of crystal nucleation in PCL. The dashed curve is a guide to eye. The triangles correspond to when the sample is crystallized at . The circle symbols correspond to at K after the sample is annealed at for 10 min. In both systems, the crystal nucleation rate is not affected by the annealing at temperatures below .

