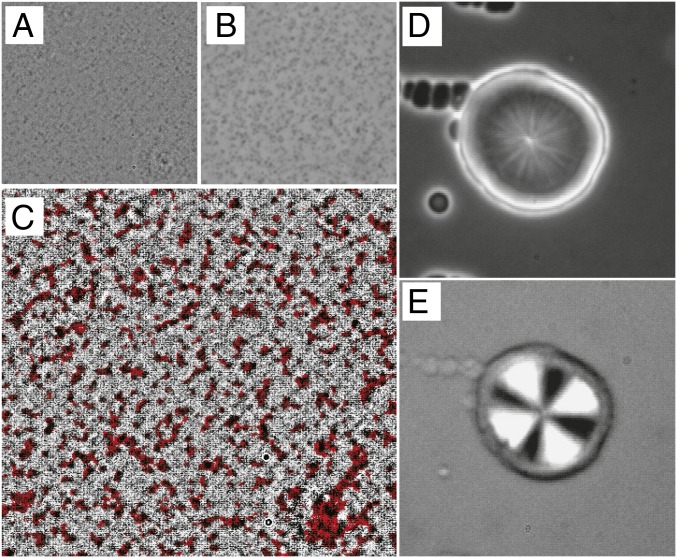
Fig. 5.
Coupling between crystallization and fluctuations. () Spatial fluctuations of observed with phase-contrast microscopy in a sample quenched to 214 K (below ) after annealing there for 120 min. The darker regions correspond to higher regions. () Crystal nuclei (dark droplets) observed with phase-contrast microscopy in the same area as panel , after heating the sample to 235 K with a rate of 20 K/min and annealing there for 5 min. () Superposition of images from (gray) and (red). We can see a clear spatial correlation between high- regions (black) and crystal nuclei (red). () A crystal spherulite that is wet by liquid II. First the crystal was formed at 235 K, and then the sample was quenched to 220 K to initiate NG-type LLT. The image is taken 80 min after the quench. We can see that the wetting layer of liquid II is preferentially formed on the surface of the spherulite in the middle of the image. Dark small droplets of liquid II are also nucleated in bulk. () Polarizing microscopy observation of the same sample as in . We can see the nonbirefringent wetting layer around the crystal spherulite with Maltese cross. The size of all images is 120 120 .

