Fig. 5.
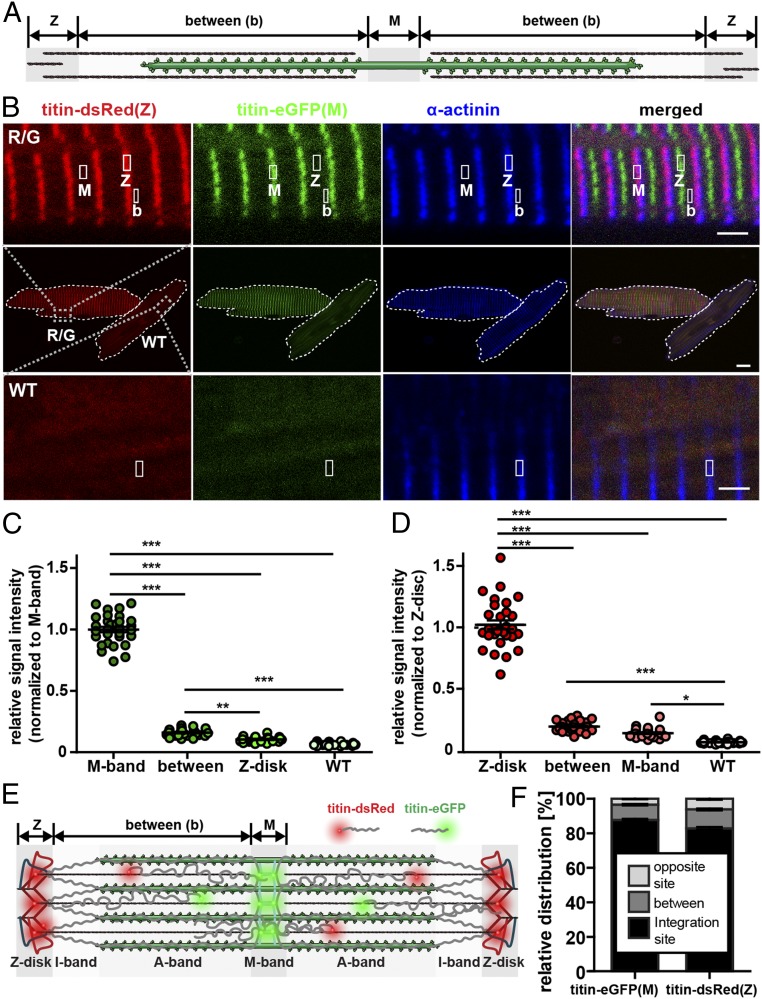
Titin’s N and C termini are not confined to their integration sites but localize throughout the sarcomere. (A) Schematic drawing of the regions of interest: Z-disk, M-band, and between the Z-disk and M-band (between) reflects titin molecules that are not incorporated into their integration sites within the myofilament. (B) Confocal images of titin-DsRed(Z)/titin-eGFP(M) and wild-type adult cardiomyocytes stained for α-actinin. M, M-band region; Z, Z-disk region; b, between. Regions of interest are indicated and magnified above for knockin cells and below for wild-type background controls. Please note the difference in signal intensity between B and the region outside the cell (background: bottom 10% of the frame). (Scale bar: middle, 10 µm; scale bar, zoomed images below and above, 2 µm.) (C and D) Relative signal intensity at selected sarcomeric regions in double-heterozygous and wild-type cells (C: 488 nm, green; D: 516 nm, red). Wild-type signal (WT) was recorded as background. Titin’s Z-disk and M-band regions localize outside the integration side with red and green signal above the WT background. M-band titin localizes at the Z-disk and Z-disk titin at the M-band, although at lower levels vs. between. (E) Schematic drawing of titin-DsRed(Z) and titin-eGFP(M) localized within and between integration sites in the mature sarcomere. (F) Less M-band titin signal is located outside its integration site (12.3%) compared to Z-disk signal (17.3%). One-way ANOVA with Bonferroni posttest; n = 30; *P < 0.05; **P < 0.01; ***P < 0.01. Error bars indicate SEM.

