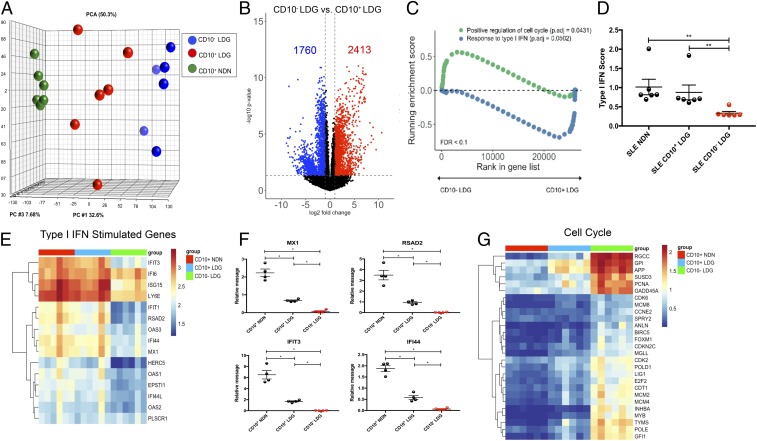
Fig. 1.
Sorted CD10− LDGs have a similar transcriptional profile to LDGimm. (A) RNA-seq was performed on sorted lupus CD10+ NDNs (green), autologous CD10− LDGs (blue), and CD10+ LDGs (red) (n = 6). (B) Volcano plot of differential gene expression between CD10− and CD10+ LDGs. Up-regulated genes with fold change ≥2 and P < 0.05 are in red, and down-regulated genes with fold change ≤2 and P < 0.05 are in blue. (C) Gene set enrichment analysis of cell cycle genes and ISGs in CD10− and CD10+ LDGs. (D–G) IFN score (D); ISG RNA-seq analysis (E); ISG expression by qRT-PCR, normalized to GAPDH expression and reported as relative message (F); and RNA-seq analysis for cell cycle genes (G) in CD10+ NDN, CD10+ and CD10− LDGs (n = 6/group for D, E, and G and n = 4/group for F). Results represent mean ± SEM from four independent experiments. *P ≤ 0.05; **P < 0.01.

