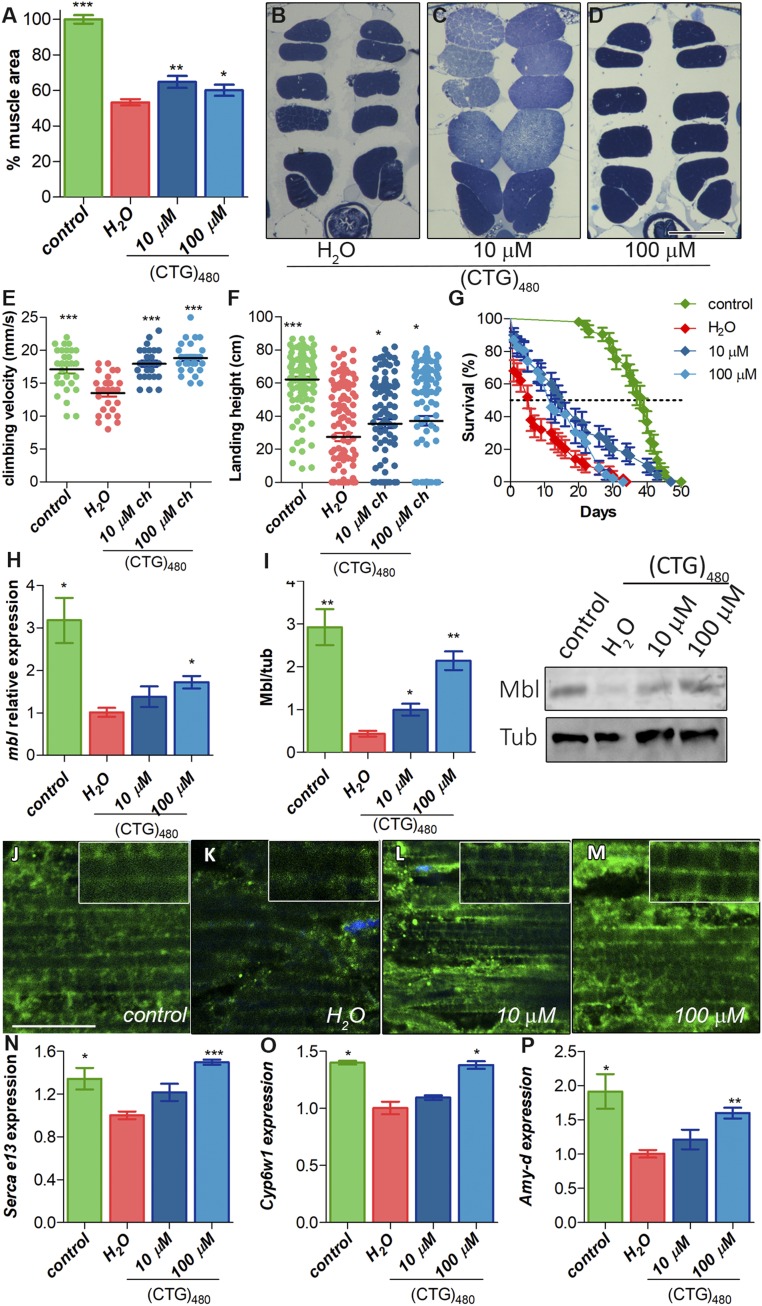
Fig. 1.
CQ treatment rescues DM1-like phenotypes in model flies by Muscleblind up-regulation. (A) Relative quantification of the mean percentage of muscle area per condition (n = 6). (B–D) Representative dorsoventral sections of resin-embedded thoraces of DM1 [Mhc-Gal4 UAS-i(CTG)480] flies treated with the indicated concentrations of CQ or vehicle. (Scale bar, 100 µm.) (E) Quantification of climbing velocity as mean of speed ± SEM (n = 30) comparing control ability (Mhc-Gal4/+; green), DM1 (red), and DM1-treated flies (blue). (F) Graphs of flight assays represent the average landing distance reached by the different experimental groups (n = 100). (G) Survival curves expressed as percentages (50 < n < 80). (H) RT-qPCR amplification of muscleblind from control (green) and DM1 flies (red) treated with CQ (blue bars) after normalization to rp49. (I) Graphs and representative blot image of Muscleblind immunodetection. α-Tubulin protein expression was used as an endogenous control. (J–M) Representative confocal images of longitudinal sections of IFMs showing anti-Mbl staining (green) in control (J), untreated DM1 flies (K), and DM1-treated flies (L and M). Nuclei were counterstained with DAPI (blue). All stainings were performed in parallel and images were acquired using the same settings. (Scale bar, 10 µm.) RT-qPCR analysis to quantify expression of Serca exon 13 (N), Cyp6w1 (O), and Amy-d (P) relative to Rp49 in the indicated conditions (n = 3). All comparisons refer to untreated DM1 flies (H2O in the graphs). *P < 0.05, **P < 0.01, ***P < 0.001 according to Student’s t test.

