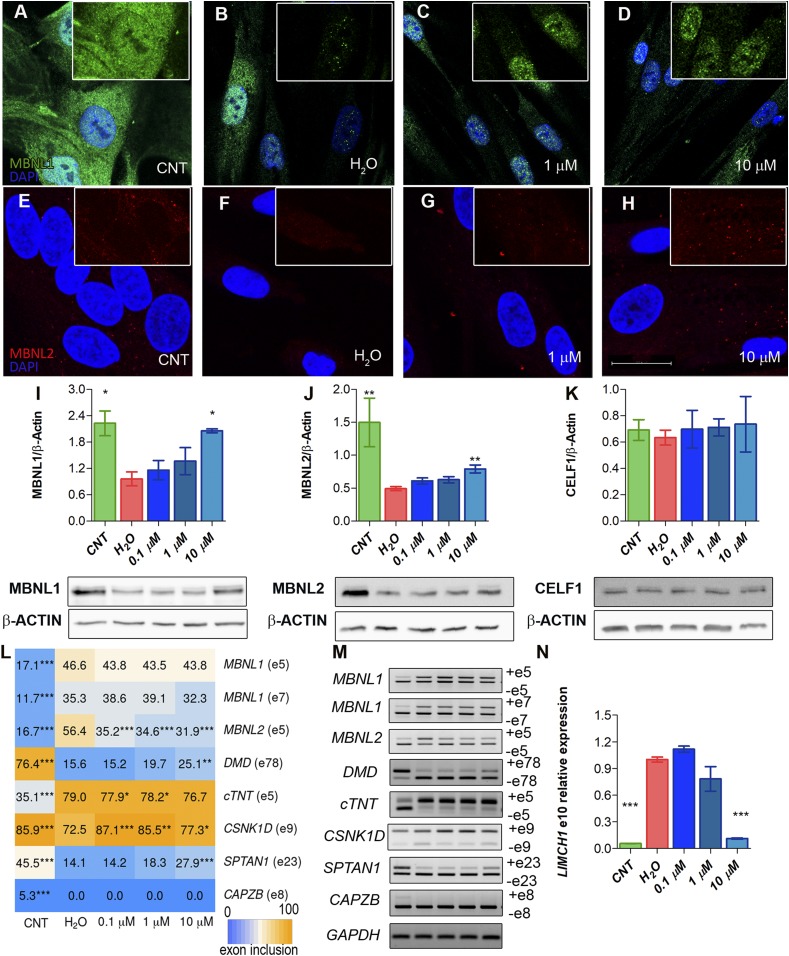
Fig. 3.
MBNL1 and MBNL2 are overexpressed upon CQ treatment of iPDMs. (A–H) Representative confocal images of MBNL1 (green) and MBNL2 (red) immunostaining in iCDMs (control [CNT]) (A and E), untreated iPDMs (B and F), and iPDMs treated with CQ (C, D, G, and H). Nuclei were counterstained with DAPI. (Scale bar, 20 µm.) (I–K) Western blot quantification and representative blot images of MBNL1 (I), MBNL2 (J), and CELF1 (K) in iCDMs (green bar) and untreated (red bar) or CQ-treated iPDMs (blue bars). β-ACTIN expression was used as an endogenous control. (L) Heatmap representing the quantification of splicing decisions altered in iPDMs. Numbers within the boxes indicate the percentage of inclusion of the indicated exons obtained by semiquantitative RT-PCR. (M) Representative gels used to quantify in L. Percentage of CELF1-regulated CAPZB exon 8 inclusion was determined as a control. (N) RT-qPCR to measure exon 10 inclusion of LIMCH1. GAPDH was used as an internal control. In all analyses, sample size was n = 3, with the exception of MBNL2 Western blot with n = 6. Cells were differentiated for 96 h. All comparisons refer to untreated iPDMs (H2O in the graphs). *P < 0.05, **P < 0.01, ***P < 0.001 according to Student’s t test.

