Fig. 4.
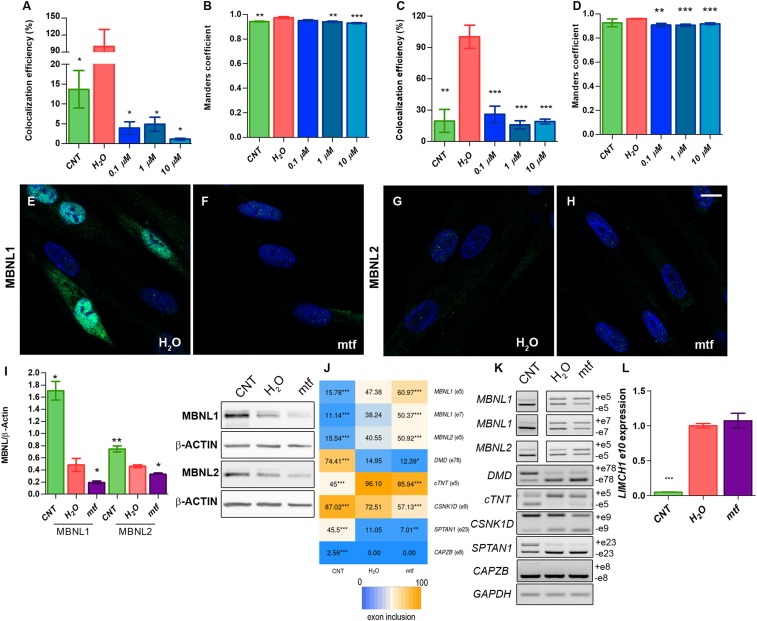
Overexpression of MBNLs by CQ is mediated by autophagy blockade in iPDMs. (A–D) Colocalization efficiency and Manders’ coefficient between MBNL1/LysoTracker (A and B) and MBNL2/LysoTracker (C and D). Colocalization efficiencies were normalized to untreated iPDMs (H2O) and data were expressed as percentage (%). No less than 70 nuclei were analyzed. (E–H) Representative confocal images of MBNL1 and MBNL2 (green) immunostaining in untreated iPDMs (E and G) or treated with mtf (F and H). Nuclei were counterstained with DAPI. (Scale bar, 10 µm.) (I) Western blot quantification and representative blot images of MBNL1, MBNL2, and β-ACTIN in iCDMs (control [CNT]; green bar), and untreated (H2O; red bar) or mtf-treated iPDMs (mtf; purple bar). β-ACTIN expression was used as an endogenous control. (J) Heatmap representing the analysis of splicing decisions altered in iPDMs and worsened after mtf treatment. Numbers within boxes indicate the percentage of inclusion of the indicated exons obtained by semiquantitative RT-PCR. (K) Representative gels used to quantify in J. Percentage of CELF1-regulated CAPZB exon 8 inclusion was determined as a control. (L) RT-qPCR to analyze exon 10 inclusion of LIMCH1. GAPDH was used as an internal control. In all analyses sample size was n = 3 and cells were differentiated for 96 h. All comparisons refer to untreated iPDMs (H2O in the graphs). *P < 0.05, **P < 0.01, ***P < 0.001 according to Student’s t test.

