Fig. 5.
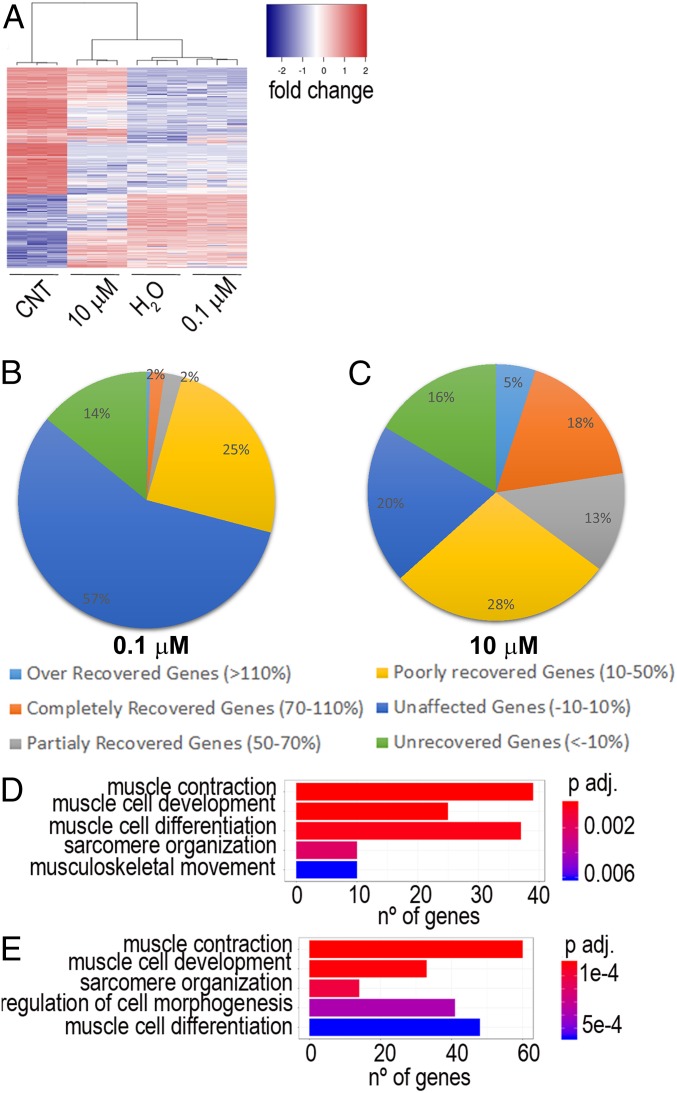
Global effect of CQ on RNA expression. (A) Heatmap representing transcript expression at the indicated conditions. (B and C) Pie charts showing the percentage of recovery of DRGs after CQ treatment. (D and E) Bar plots based on GO analysis showing the principal biological processes affected by 0.1 µM (D) and 10 µM (E) CQ in DM1. CNT, control.

