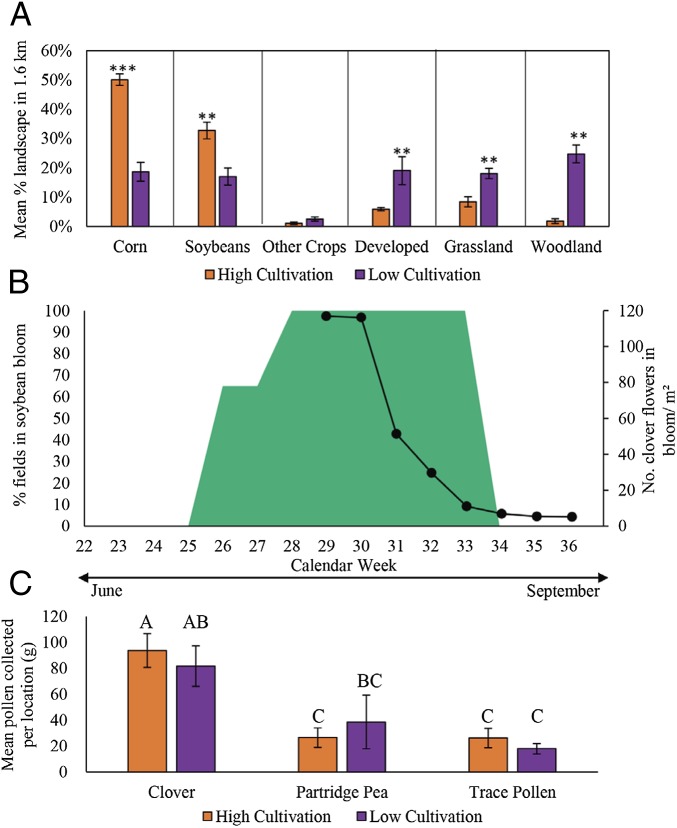
Fig. 3.
Even though land use differs significantly, pollen collection is driven by few plants. (A) Site averages of percent landscape features within 1.6-km radius of apiaries in high- (red solid bars) and low-cultivation (purple pattern bars) landscapes in 2015 and 2016, mean ± SEM. There was significantly more corn and soybean in high-cultivation landscapes. Low-cultivation landscapes consisted of significantly more developed land, low forb diversity grasslands, and woodland. Results based on t tests; **P < 0.05, ***P < 0.0001 for statistical difference between cultivation categories for each landscape feature. (B) Percentage of fields in soybean bloom (green and filled area) across the season in 2015 and 2016 (represented in left axis). Number of clover blooms present per meter square (solid lines and circles) in 2016 transect (represented in right axis). (C) Mean colony collected pollen grams in high- (red solid bars) and low-cultivation (purple pattern bars) landscapes in 2015 and 2016, mean ± SEM. There were no significant differences in total pollen collected by cultivation category; however, significantly more clover pollen was collected in both landscapes compared to partridge pea (T36 = 4.68, P = 0.0001) and trace pollens (T36 = 5.57, P ≤ 0.0001). Partridge pea and trace pollen amounts did not differ (T36 = 1.97, P = 0.6513). Results based on mixed-model ANOVA with post hoc Tukey comparisons; no significance was detected between cultivation categories for each pollen type collected (SI Appendix, Table S12).

