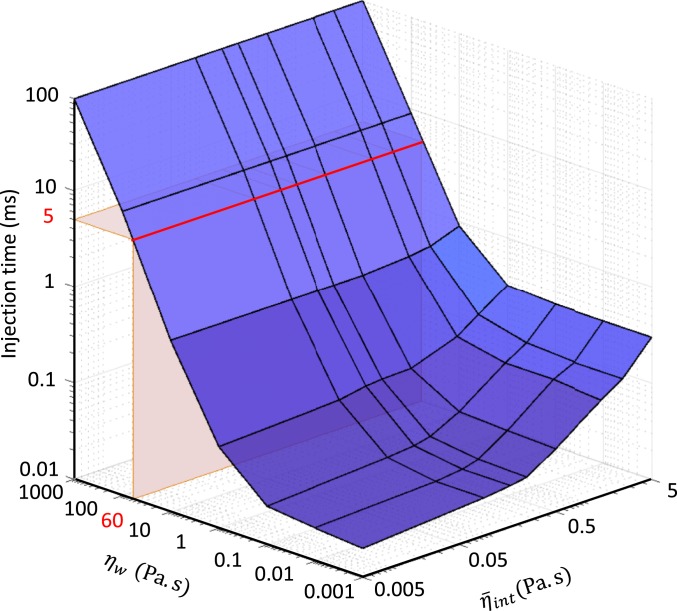
Fig. 9.
Complete dynamic model of the T4 injection machinery interacting with the host cell predicts the timescale of the injection process as a function of the sheath–tube gap viscosity coefficient over the range and the internal friction coefficient over the range . Note log scales. Red region defines a likely injection timescale for T4 (∼5 ms) by drawing a comparison with that of the T6SS (26).

