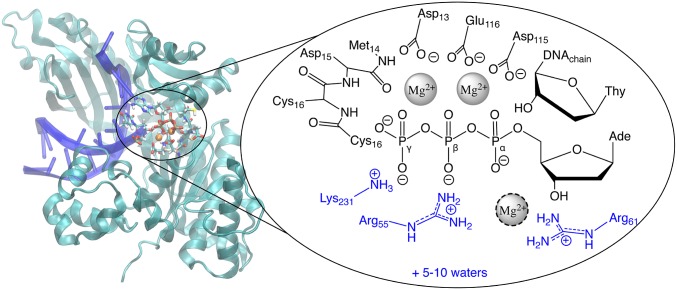
Fig. 2.
The structure of DNAP, highlighting the active site groups that were treated at the QM level during simulations. We have shown the reactant state here; other states used the same protein residues in the QM region, but the details of the nucleotide/DNA and protonation states differed depending on the particular objective. QM link atoms were placed between Cα and Cβ for most protein residues. Link atoms in the backbone between the carbonyl C and Cα allowed us to include the backbone from M14-C16; the side chains of D15 and C16 were omitted with link atoms between Cα and Cβ. The Mg2+ surrounded by a dotted line was only present at all in models based on the crystal structure of the product. The protein residues colored blue were not included in the QM region in simulations that used the small QM region, and the small QM region contained only 2 QM waters. The 2D free-energy surfaces used the small QM region.

